
NMR Analyser plugin
Short answer: Install NMR Analyser from Settings, Plugins, draw a molecule, open the NMR tab, pick an experiment and press Predict.
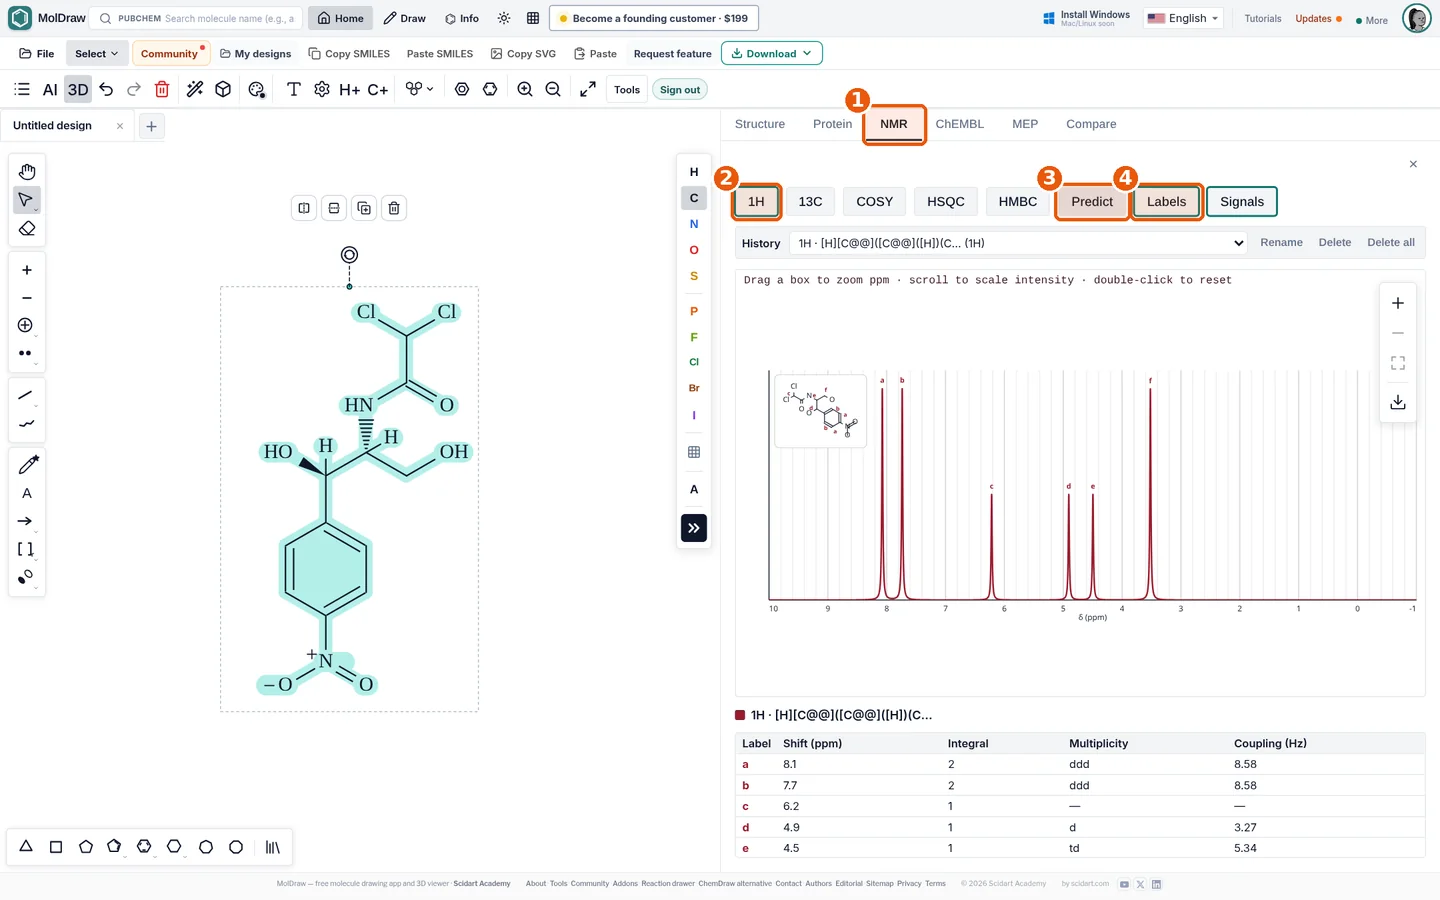
- NMR tab in the right-hand analysis panel.
- Experiment buttons: 1H, 13C, COSY, HSQC, HMBC.
- Predict runs the prediction for the current canvas structure.
- Labels / Signals toggle peak letters and the signal list.
What it does#
The plugin predicts NMR spectra for the structure on your canvas.
- 1D 1H and 13C spectra show peaks with letters.
- The table gives shift, integral, splitting and coupling constant for each letter.
- 2D COSY, HSQC and HMBC show as contour plots. You can see which atoms are linked.
- Each run goes into History. Switch between molecules or experiments there.
To learn the basics, read How to read an NMR spectrum.
Who it is for#
Students who check a structure against a lab spectrum. Teachers who make worked examples. Chemists who want a quick sanity check.
How to use it#
- Open the MolDraw editor and sign in. Click Settings, then Plugins, then Install next to NMR Analyser.
- Draw or paste your structure (e.g. paste a SMILES with Paste SMILES).
- Open the NMR tab in the right panel (callout 1).
- Choose the experiment, 1H or 13C for 1D, or COSY/HSQC/HMBC for 2D (callout 2).
- Press Predict (callout 3). The spectrum appears in a few seconds.
- Drag a box to zoom into a ppm range, scroll to scale intensity, double-click to reset.
- Turn on Labels (callout 4) to match peak letters with the table and hover a row to highlight the atoms.
- Export the plot (PNG/SVG) or the peak list (CSV) with the download button.
Tips#
- Draw explicit stereochemistry: diastereotopic protons can give different predicted shifts.
- Use HSQC to assign which H sits on which C, then HMBC to connect fragments across quaternary carbons.
- Predictions are for CDCl3-like conditions; OH/NH shifts vary a lot with solvent and concentration.
- New to NMR. Read how to read an NMR spectrum first.
Questions and answers
How accurate is the predicted NMR?
Typical 1H predictions fall within about 0.2 to 0.3 ppm and 13C within a few ppm for common organic molecules. Exchangeable OH/NH protons and unusual ring systems can deviate more, so treat predictions as a guide, not a measured spectrum.
Does the NMR Analyser need an account?
Yes. Plugins are installed to your free MolDraw account. For a no-login quick check, use the free structure to NMR tool.
Can it predict 2D NMR?
Yes: COSY, HSQC and HMBC are drawn as contour plots alongside the 1D 1H and 13C spectra.
Can I export the spectrum?
Yes. Download the plot as PNG or SVG and the peak table as CSV.