How to Read TGA and DSC Curves with the Free MolDraw Thermal Analysis Viewer
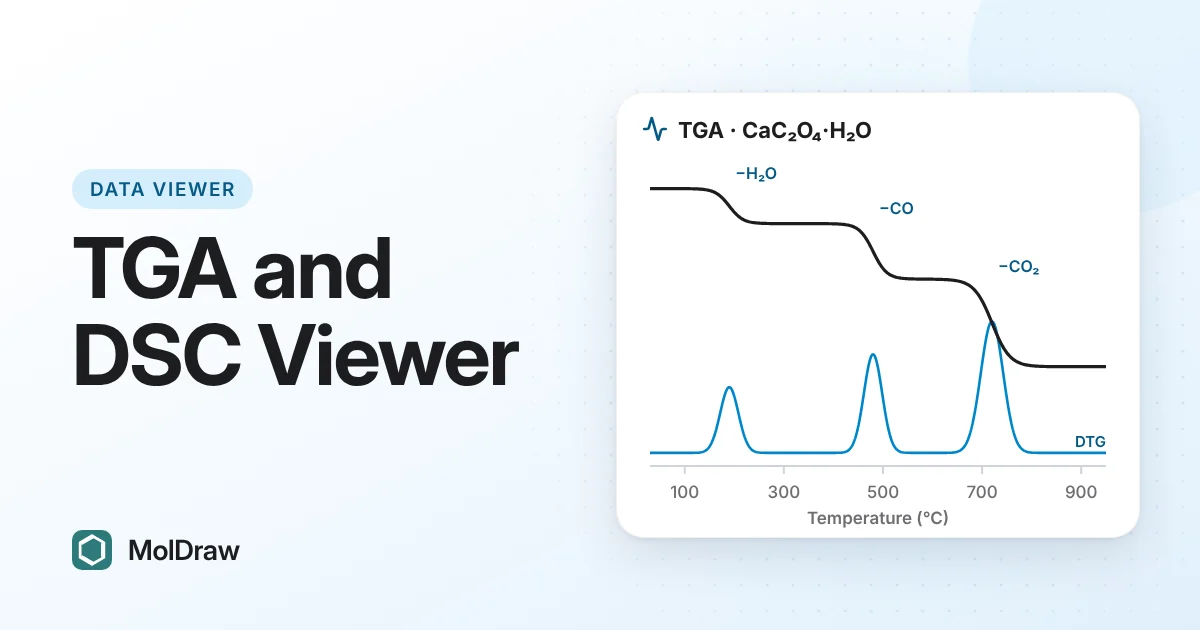
Short answer: Open the TGA and DSC viewer, press Open TGA / DSC file(s) or drop a CSV, TA Instruments, NETZSCH or METTLER text export onto the page. The viewer lists each TGA step with its onset, DTG peak, mass loss and the final residue. For DSC it finds the glass transition, melting and crystallisation, with ΔH and % crystallinity. Your files stay on your device.
Try the TGA and DSC viewer here
Press CaC2O4·H2O (TGA + DSC) in the live viewer to load a classic three-step example.
Why use a browser viewer for thermal analysis?
Thermal analysis software is often licensed to the computer next to the instrument, and exports from different makers disagree on units and on which way an endotherm points. The MolDraw viewer reads the common text exports, lets you set the sign convention, and measures steps and peaks the same way every time.
TGA and DSC in brief
Thermogravimetric analysis (TGA) records the mass of a sample as it heats. Each drop is a mass-loss step, such as loss of water or solvent, or decomposition. The mass left at the end is the residue, such as ash, filler or an oxide.
The DTG curve is the derivative of mass with temperature. It turns each step into a peak at the point of fastest loss. The onset temperature is usually found with tangents: the tangent at the steepest point meets the plateau before the step.
Calcium oxalate monohydrate is the textbook example. It loses water (12.3 % of the starting mass), then carbon monoxide (19.2 %), then carbon dioxide (30.1 %), and leaves calcium oxide.
Differential scanning calorimetry (DSC) measures the heat flow into a sample compared with a reference. The glass transition (Tg) is a step, caused by a change in heat capacity (Δcp). Melting is an endothermic peak. Crystallisation on cooling is exothermic, as is cold crystallisation on heating a quenched polymer such as PET.
The area of a peak gives the enthalpy ΔH. For a semicrystalline polymer, crystallinity is Xc = (ΔHm − |ΔHcc|) / (ΔH100% × w) × 100, where ΔH100% is the melting enthalpy of a fully crystalline polymer and w is the polymer weight fraction. Pure metals such as indium check the temperature and enthalpy calibration.
Files the viewer opens
| CSV or TXT | Temperature or time, mass or mass %, and heat flow columns. |
|---|---|
| Instrument exports | TA Instruments Universal Analysis or TRIOS text exports, NETZSCH Proteus ASCII exports and METTLER STARe table exports. |
| Mass | Mass in mg is converted to % of the starting mass. |
| Segments | Heating and cooling ramps are split into segments. Isothermal holds are skipped. |
How to analyse a run step by step
- Press Open TGA / DSC file(s), or drop files on the box. To explore first, press Filled polymer TGA, PET DSC or Indium calibration.
- Choose TGA, DSC or TGA + DSC, then the Segment, for example the first heating ramp.
- Open Settings. Check Heating rate (K/min), Sample mass (mg) and In the file, endothermic is. Pick Endo up or Exo up under Plot.
- Read the TGA steps table: onset, midpoint, DTG peak, endset, mass loss and residue.
- Read the DSC events table. Press × to drop a false event. If a peak was missed, zoom to it and press Integrate current view as a peak.
- Under DSC crystallinity, pick a Polymer or type ΔH100% (J/g), and set Polymer fraction w (%) for filled samples.
- Tick Add to compare instead of replacing to overlay more runs. Save with Export PNG or Export CSV.
What the viewer does
- TGA steps: the DTG curve on a second axis, shaded step ranges, and mass loss in % and in mg when the sample mass is known.
- DSC events: Tg with onset, midpoint, inflection, endset and Δcp. Peaks with onset, peak, endset and ΔH, shaded above the baseline.
- Baselines and smoothing: choose a Linear or Sigmoid DSC baseline, and set DTG smoothing (°C).
- Crystallinity presets: ΔH100% values for twelve common polymers, including PE, PP, PET, PLA and nylon 6.
- Calibration check: when a melting onset is close to indium, tin, zinc or bismuth, the viewer compares the onset and ΔH with typical reference values.
- Peaks with mass loss: in runs with both mass and heat flow, DSC peaks that overlap a TGA step are labelled "with mass loss", which helps tell decomposition from melting.
- Combined view and export: TGA + DSC puts mass and heat flow on two axes. The CSV holds the processed curves and the results tables.
Ways to use it in class and in the lab
- Hydrates and solvates: compare the measured water loss with the value from the formula, using the molar mass calculator.
- Filler and ash content: read the residue of a filled polymer run in air.
- Polymer crystallinity: load a PET heating run, find cold crystallisation and melting, and get Xc.
- Batch comparison: overlay runs and compare onsets and residues.
Tips and limits
- Check the endotherm sign first. A wrong sign swaps the melting and crystallisation labels.
- ΔH is the peak area divided by the heating rate, so a wrong rate gives a wrong ΔH.
- Onsets shift with heating rate, sample mass and gas. Compare only runs measured the same way.
- Integrate current view as a peak adds a peak, not a glass transition.
- With the X axis set to Time, the viewer shows raw curves without analysis marks.
The tools page lists all the free MolDraw data viewers.
Questions and answers
What is the difference between the TGA onset and the DTG peak?
The onset is where the step starts, from a tangent extrapolated back to the plateau. The DTG peak is where mass is lost fastest. On heating, the DTG peak lies above the onset, so state which one you report.
Why does my melting peak show up as exothermic?
The sign convention in the file was guessed the wrong way. Change In the file, endothermic is to the other option. Plot only sets whether endotherms point up or down on screen.
Can I get ΔH in J/g if my heat flow is in mW?
Yes. Type the sample mass in Sample mass (mg). The viewer then divides the heat flow by the mass and reports ΔH in J/g.
How do I check my DSC calibration with indium?
Open your indium run. When a melting onset lies close to that of indium, tin, zinc or bismuth, the viewer shows the onset and ΔH differences from typical values. Use your standard's certificate for the final check.