Clean Up and Read Raman Spectra Online: Raman Shift, Fluorescence Baselines and Cosmic-Ray Spikes
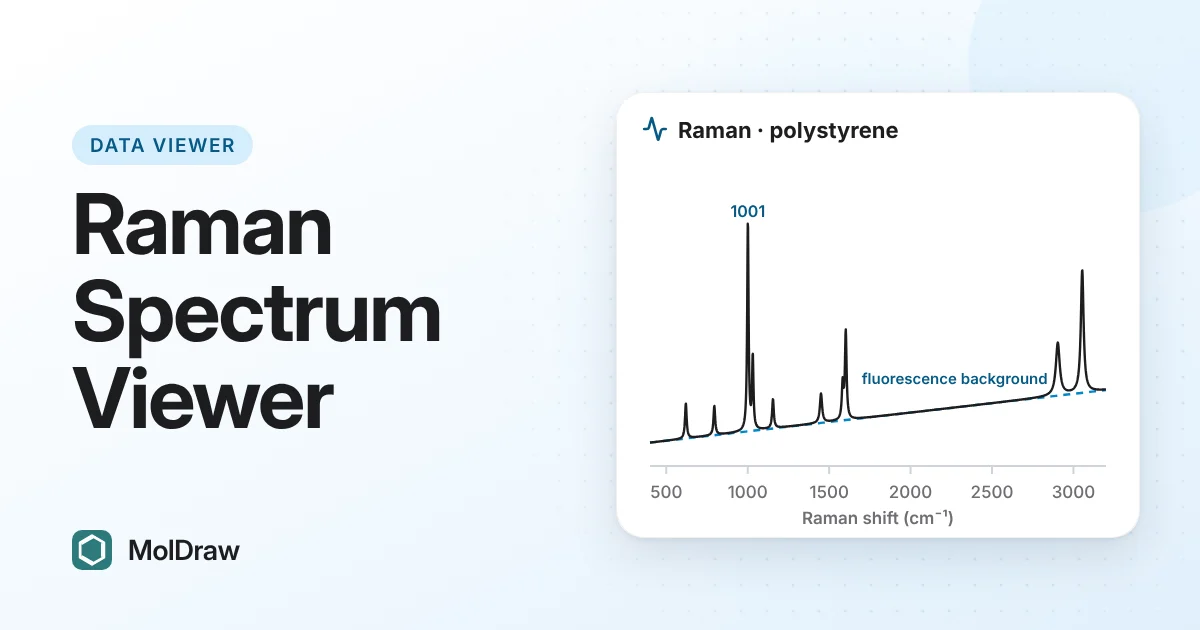
Short answer: Open a JCAMP-DX, CSV/TXT or SPC file in the free MolDraw Raman viewer, or press Polystyrene. If the x axis is in nm, pick your laser to get the Raman shift. Tick Remove spikes, smooth if needed and choose a baseline to take away fluorescence. Then read the peak table with likely bands and export a PNG or the cleaned CSV. Your files stay on your device.
Try the Raman viewer here
Why clean up Raman data before you read it?
Raw Raman spectra are rarely ready to read. Bands sit on a fluorescence hump, cosmic rays add spikes that look like peaks, and some instruments save the x axis in nm. Each fix is simple, but together they take time in a spreadsheet. The viewer puts them on one page, and you see each step on the plot before you trust a peak.
The science in brief
Raman shift. When laser light hits a sample, a tiny fraction scatters with less energy because it has excited a vibration. The Raman shift is that energy loss in cm⁻¹: shift = 107/λlaser − 107/λscattered, with both wavelengths in nm. A band has the same shift with any laser.
Which bands are strong. A vibration is Raman active when it changes the polarisability of the molecule. Symmetric stretches, C=C and ring breathing are strong. Polar groups such as O–H, strong in IR, are often weak in Raman.
For those polar groups, read the band positions in an IR spectrum. The two techniques fill each other’s gaps.
In a molecule with a centre of symmetry, no vibration is both IR and Raman active. This is the rule of mutual exclusion. To check whether it applies, find the molecule’s point group with the Symmetry plugin.
Laser wavelength. Scattering is stronger at shorter wavelengths, so 532 nm gives more signal but often more fluorescence. Lasers at 785 or 1064 nm often reduce fluorescence at the cost of signal.
Fluorescence and spikes. Fluorescence adds a broad background that can be far stronger than the Raman bands. Cosmic rays hit the detector at random and give spikes one or two points wide.
Files you can open
- JCAMP-DX (.jdx, .dx). If the file records the laser wavelength, the viewer picks it up.
- CSV or TXT with two columns: Raman shift or wavelength in nm, then intensity.
- SPC, the Thermo/Galactic binary format (new format).
The viewer checks the units and headers to spot an nm axis. Pick several files to overlay them. To practise, download the sample .jdx, a cyclohexane spectrum in nm from a 785 nm laser. All examples are simulated.
How to clean and read a spectrum, step by step
- Press Open Raman file(s) or drop files on the box. Or press an example: Polystyrene, Graphene vs graphite, Silicon, Cyclohexane or Sample .jdx (nm, 785 nm laser).
- Under Laser and x axis, pick 532, 633, 785 or 1064 nm, or Other to type a value. If a file in nm was not detected, tick File x axis is wavelength in nm.
- Under Clean up, tick Remove spikes. Raise the threshold if a real narrow band is touched.
- Tick Savitzky-Golay smooth only for noisy data, with a small window.
- Choose a Baseline: Asymmetric least squares, with its Stiffness λ slider and p, or Polynomial with an Order. With Show before and baseline ticked, check that the red dashed line runs under the peaks.
- Read Peaks and likely bands. Use the Peak prominence slider to show more or fewer peaks.
- To compare files, tick Normalise. Then press Export PNG or Export CSV.
What the viewer does
| x axis | Converts nm to Raman shift for 532, 633, 785, 1064 nm or a custom laser. |
|---|---|
| Spikes | Finds narrow points far above their neighbours and fills them in. The plot shows how many spikes were removed. |
| Smoothing | Savitzky–Golay, window 5 to 21 points, order 2 to 4. |
| Baseline | Asymmetric least squares or polynomial, shown as a red dashed line. |
| Peaks | Shift, height and FWHM for up to 25 peaks, each matched to a table of common Raman band ranges. |
| Carbon check | D, G and 2D positions, ID/IG, I2D/IG, 2D width and a note on layers and defects. |
| Export | PNG of the plot and CSV of the cleaned, visible spectra. |
Ways to use it in class and in the lab
- Polymer identification: the Polystyrene example shows the strong ring breathing band near 1001 cm⁻¹ and the aromatic C=C band near 1602 cm⁻¹ after the fluorescence is removed.
- Calibration checks: crystalline silicon gives one sharp band at 520.7 cm⁻¹, and cyclohexane is a common shift standard. Compare your reference spectrum with the known values.
- Graphene and carbon: load Graphene vs graphite and compare the 2D band shape and D/G ratio. To see how much of the carbon is bonded to oxygen, fit the C 1s region of an XPS spectrum.
- Teaching Raman shift: open the sample .jdx in nm and switch the laser to see how the conversion depends on it.
Tips and limits
- A baseline that follows the data too closely can eat broad bands. In ALS, a larger λ gives a stiffer line. In a polynomial, a lower order bends less.
- Smoothing lowers and widens sharp bands. Use the smallest window that works, and compare FWHM only between spectra treated the same way.
- Band assignments come from general ranges. The viewer uses organic groups when C–H stretch peaks are present, and carbon and inorganic bands when they are not. Confirm assignments with a reference.
- Band heights depend on the laser, optics and detector. Normalise to compare shapes, not absolute intensities.
- The CSV puts all visible spectra on the shift values of the first one, so other spectra are interpolated.
Questions and answers
Why does my Raman spectrum sit on a large sloping background?
That is usually fluorescence from the sample or from impurities. It is often much stronger than the Raman signal. A longer laser wavelength, such as 785 or 1064 nm, often reduces it. In the viewer, choose a baseline to subtract what remains.
Does the Raman shift depend on the laser wavelength?
No. The shift is the energy the light loses to a vibration, so a band sits at the same cm⁻¹ with any laser. The absolute wavelength of the scattered light does change, which is why a file in nm needs the laser wavelength.
How can I tell a cosmic-ray spike from a real band?
A spike is one or two points wide and appears at a random place. If you record the spectrum again, it moves or disappears. A real band is wider and repeats in every acquisition.
Should I choose an ALS or a polynomial baseline?
Try asymmetric least squares first for curved fluorescence backgrounds. Use a polynomial for a smooth, gently bending background. In both cases, check that the red dashed line runs under the peaks and does not cut into broad bands.