Check Isotope Patterns, Adducts and ppm Error in Your Browser
Short answer: Open the free MolDraw mass spectrum viewer and drop in a JCAMP-DX, CSV/TXT, mzML or mzXML file. Type the formula, SMILES or peptide you expect and pick the ion. The viewer overlays the theoretical isotope pattern, lists which common adducts are present, works out the ppm error and labels neutral losses. Export a PNG or CSV. The file is read in your browser and is not uploaded.
Try the mass spectrum viewer here
Why use a browser mass spectrum viewer?
A mass spectrum answers two questions: is the mass right, and does the pattern fit the formula? Instrument software can answer both, but it is often locked to one PC. Students may only get a printout or an exported file.
This viewer puts the measured spectrum and the theory on one plot. You can see at a glance whether a chlorine pattern is there, whether your main ion is [M+H]+ or [M+Na]+, and how far the measured mass is from the calculated one.
Mass spectrometry basics you need here
m/z is the ion mass divided by its charge. For singly charged ions it equals the ion mass. A 2+ ion appears at about half its mass, and its isotope peaks sit 0.5 apart.
Ionisation decides what you see. Electron ionisation (EI) gives a radical cation M+• and many fragments. Electrospray (ESI) is softer and mostly gives [M+H]+, [M+Na]+ or [M−H]−. A sodium adduct sits about 22 above [M+H]+, so a pair of peaks 22 apart is a common clue.
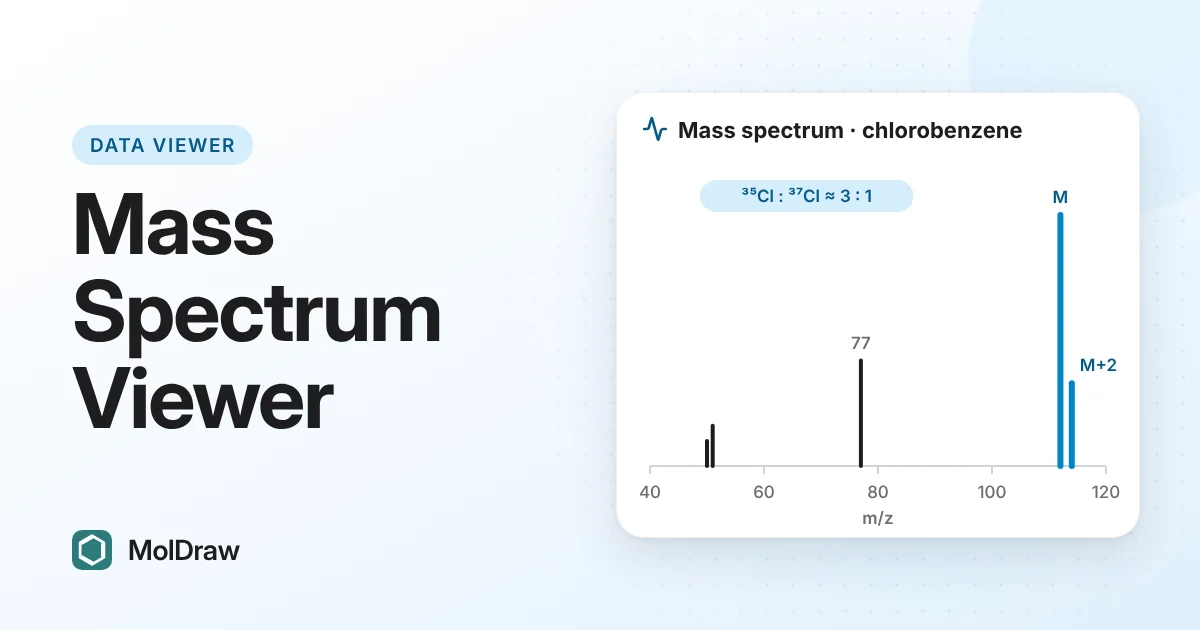
Isotope patterns help confirm the formula. Each carbon adds about 1.1% to the M+1 peak. Chlorine (35Cl and 37Cl) gives M and M+2 in about a 3:1 ratio. Bromine (79Br and 81Br) gives about 1:1.
ppm error compares a measured and a calculated m/z: (measured − theoretical) / theoretical × 106. For caffeine [M+H]+ at m/z 195.0877, an error of 1 mDa is about 5 ppm. This only makes sense for high-resolution data.
Which files it opens
| JCAMP-DX | .jdx, .dx or .jcamp mass spectra, as peak tables or continuous data. |
|---|---|
| CSV or TXT | Columns of m/z and intensity. |
| mzML and mzXML | The first spectrum in the file. Compressed (zlib) arrays work in current browsers. |
How to check a spectrum against a formula
- Press Open mass spectrum or drop the file on the box. To practise, press Caffeine ESI [M+H]+.
- Check the line above the plot. It says whether the data is profile or centroid and whether it is unit or high resolution.
- In Formula, SMILES or peptide, choose the input type and type your compound, for example C8H10N4O2.
- Pick the Ion, such as [M+H]+ for ESI or M+• (EI) for EI. Leave Pattern on Auto resolution unless you need another setting.
- Press Zoom to ion. Compare the red theoretical sticks with your peaks, and read the Theory % and Found % columns.
- Tap the measured peak, or its row under Main peaks, to fill Measured m/z. Read the ppm error.
- Scan the Common adducts table for other ions that are present.
- Export with Export PNG or Export CSV.
What the viewer does
| Plot | Auto, Stick or Profile style, Zoom, Pan, + and −, Reset view and Zoom to ion. A Labels slider sets how many peaks are labelled. |
|---|---|
| Display | Base peak = 100%, Isotope overlay, Mirror (theory below) and Neutral losses can each be turned on or off. |
| Calculator | Formula, SMILES or one-letter peptide. Gives monoisotopic mass, average (molar) mass, exact m/z of the chosen ion and most abundant m/z. |
| Ions | Positive and negative adducts, including [M+H]+, [M+Na]+, [M+K]+, [M+NH4]+, [M+2H]2+, [2M+H]+, [M−H]−, [M+Cl]− and [M+HCOO]−. |
| Pattern | Auto resolution, Unit (nominal), High (0.01 Da) or Fine structure. A halogen check notes Cl and Br patterns. |
| Checks | ppm and mDa error, a common adducts table with found peaks, and neutral loss labels between main peaks. |
| Export | PNG of the plot and CSV of the data. Profile data also gets a centroid list. |
Ways to use it in class and in the lab
- Teaching halogen patterns: load Chlorobenzene EI and Dibromobenzene EI. Students see the 3:1 and 1:2:1 clusters next to the theory.
- Characterisation data: check the found and calculated m/z for a new compound before you write it up. The tool treats an error within 5 ppm as a good match for high-resolution data.
- Peptides: load Peptide ESI, enter the sequence in one-letter code and pick [M+2H]2+ or [M+3H]3+ to match charge states.
- Fragment reading: use the neutral loss labels to discuss which groups break off in EI. To compare with an expected pattern, predict an EI mass spectrum from your drawing with the Spectroscopy plugin, and treat it as a rough estimate.
Tips and limits
- Enter the neutral formula and let the Ion menu add or remove atoms. Do not enter the ion formula yourself.
- For mzML and mzXML, only the first spectrum is shown. Export the scan you need if it is not the first.
- At unit resolution, different losses can share a nominal mass. CO and C2H4 both give a gap of 28, so both may be listed.
- The SMILES reader covers common organic SMILES. If one fails, enter the formula instead.
- A good isotope match supports a formula but does not prove a structure. Use NMR and IR as well.
New to mass spectra? Our guide on how to read a mass spectrum explains molecular ions, fragments and isotope peaks.
Questions and answers
Can I use the viewer without a spectrum file?
Yes. Type a formula, SMILES or peptide in the calculator box and pick an ion. You get the monoisotopic mass, average mass, exact m/z and the isotope pattern without opening any data.
Why is the molecular ion small or missing in my EI spectrum?
Electron ionisation at 70 eV leaves the ion with a lot of excess energy, so many molecular ions break up before they reach the detector. Alcohols and branched compounds are common examples. A softer method such as ESI or CI usually shows the intact molecule.
Why is the tallest peak in my cluster not the monoisotopic ion?
Every carbon has about a 1.1% chance of being 13C. In large molecules such as peptides, the ions that hold one or more 13C atoms can outnumber the all-12C ion. The calculator shows both the exact m/z and the most abundant m/z.
Why does the tool say a ppm error is not meaningful?
Your file has unit-resolution masses, such as a typical EI spectrum from a quadrupole. The m/z values are whole numbers or close to it, so a ppm error tells you nothing. Use high-resolution data for ppm checks.