XPS Peak Fitting in Your Browser: Charge Correction, Shirley Background, Doublets and Atomic %
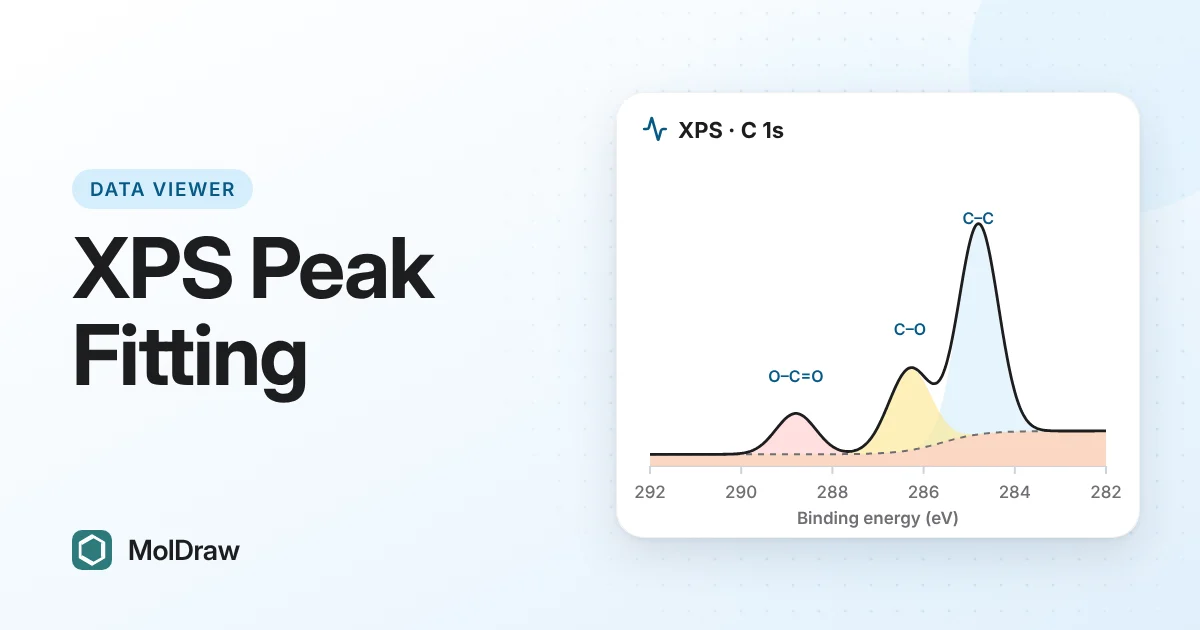
Short answer: Open a VAMAS (.vms), CasaXPS text or CSV file in the free MolDraw XPS viewer, or press C 1s (polymer). Press Set from C 1s to charge correct, keep the Shirley background, then press Auto peaks or C 1s template and Fit. Read the atomic % and export a PNG or a CSV with the fit table. Your files stay on your device.
Try the XPS viewer here
Why fit XPS data in a browser?
XPS data often arrives as a VAMAS or text file from a shared facility. To read it, you correct for charging, remove the background, fit components and turn areas into composition. Full packages do this well, but they are not always at hand. The viewer covers the core steps on one page, for a first look, for teaching or for checking a fit someone sent you.
The science in brief
Binding energy. X-rays eject electrons from core levels. The spectrometer measures their kinetic energy, and BE = hν − KE, with the work function handled by the calibration. Al Kα gives hν = 1486.6 eV and Mg Kα 1253.6 eV. Only electrons from the top few nanometres escape, so XPS sees the surface.
Chemical shift. Bonds to more electronegative atoms move a core level to higher binding energy. In C 1s, C–C/C–H sits lowest, then C–O, C=O and O–C=O.
Charge correction. Insulators charge up and every peak shifts by the same amount. A common fix is to set the C–C/C–H peak of adventitious carbon to 284.8 eV, the viewer's default. Some labs use 285.0 eV. This is a convention with known limits, so state the value you used.
Shirley background. Electrons that lose energy on the way out raise the signal on the high binding energy side of each peak. The Shirley background models this step.
Spin–orbit doublets. p, d and f levels split into two peaks with a fixed area ratio: 1:2 for p, 2:3 for d and 3:4 for f. The split depends on the element, for example about 13.6 eV for Fe 2p in the viewer's table.
Atomic %. Divide each element's peak area by its sensitivity factor, then normalise the results to 100%.
Files you can open
- VAMAS (.vms), the ISO 14976 exchange format, with regular scans.
- CasaXPS text exports with K.E. or B.E. columns.
- CSV, TXT, DAT or TSV with an energy column and an intensity column.
Open one file at a time. Each region in a file gets its own button above the plot. To practise, download the sample .vms, which holds a survey, C 1s and O 1s. All examples are simulated.
How to fit a region, step by step
- Press Open XPS file or drop a file. Or press an example: C 1s (polymer), Si 2p (Si / SiO2), Fe 2p doublet, Survey scan or Sample .vms.
- If your data is in kinetic energy, set Energy axis to Kinetic energy and choose the Source.
- Press Set from C 1s, or type a Charge shift (eV). The reference starts at 284.8 eV and can be changed.
- Pick a region, check the Core level (for example C 1s) and choose a Background. Zoom in and press Fit window = current view, or use Whole region.
- Press Auto peaks, or choose Add peak and tap the plot, or press C 1s template. Then press Fit.
- Edit label, BE, FWHM, %L or doublet type in the table, lock values, or drag peaks in Move peak mode. Press Fit again.
- Check the envelope and the residual line under the spectrum. Then press Export PNG or Export CSV.
What the viewer does
| Background | Shirley, linear or none, over a fit window you choose. |
|---|---|
| Peak shape | Gaussian–Lorentzian product, GL(m). |
| Fitting | Auto or manual peaks, a C 1s template, locks, Same FWHM for all peaks and Fit %L too. Reports the RMS residual and, where it can, a reduced χ². |
| Doublets | p, d or f doublets with a split from a built-in table that you can edit. |
| Assignments | A suggested chemical state for each peak. |
| Atomic % | From two or more fitted regions, with sensitivity factors you can edit. |
| Survey | Element list with lines, confidence and a rough atomic %. Auger regions are shaded. |
| Export | PNG of the plot. CSV with the data, background, components, envelope, fit table and atomic %. |
Ways to use it in class and in the lab
- Polymer surface treatment: fit C 1s before and after plasma treatment. Larger C–O, C=O and O–C=O components point to surface oxidation. XPS sees only the top few nanometres. For the bulk polymer, find its melting point and crystallinity in the TGA and DSC viewer.
- Native oxide on silicon: the Si 2p example shows Si as a narrow doublet and SiO2 as a broader peak at higher binding energy.
- Unknown surfaces: open a survey to see which elements are present.
- Composition: fit C 1s and O 1s in the sample .vms and read the O/C ratio from the atomic % box.
Tips and limits
- Give every component a chemical reason. Extra peaks always lower the residual, but that does not make them real.
- Metals often need an asymmetric line shape, which the viewer does not model. Transition metal 2p spectra can also show satellites and multiplet splitting, so a simple doublet fit is an approximation.
- The built-in sensitivity factors are approximate Al Kα values relative to C 1s = 1. Enter factors from your instrument library for real numbers.
- Literature binding energies spread by a few tenths of an eV. Check suggested assignments against a reference.
Questions and answers
Why are all my peaks about 1 eV higher than expected?
An insulating sample charges up as electrons leave it, and every peak moves to higher binding energy by the same amount. Press Set from C 1s to move the C-C / C-H peak to the reference energy, or type the shift yourself.
How many components should I fit to a C 1s peak?
Only as many as the chemistry supports. Start from the bonds you expect in the sample, keep the widths similar, and add a peak only when the residual shows a clear, repeatable shape that a known chemical state explains.
Why use a Shirley background instead of a linear one?
Electrons that lose energy on the way out raise the signal on the high binding energy side of a peak. A Shirley background follows that step. A straight line can work for small peaks on a flat background.
Can I get atomic % from a survey scan alone?
Only roughly. The viewer gives a rough atomic % in the survey table. For better numbers, fit narrow scans of each element and use sensitivity factors from your own instrument.