How to Read a Cyclic Voltammogram with the Free MolDraw CV Viewer
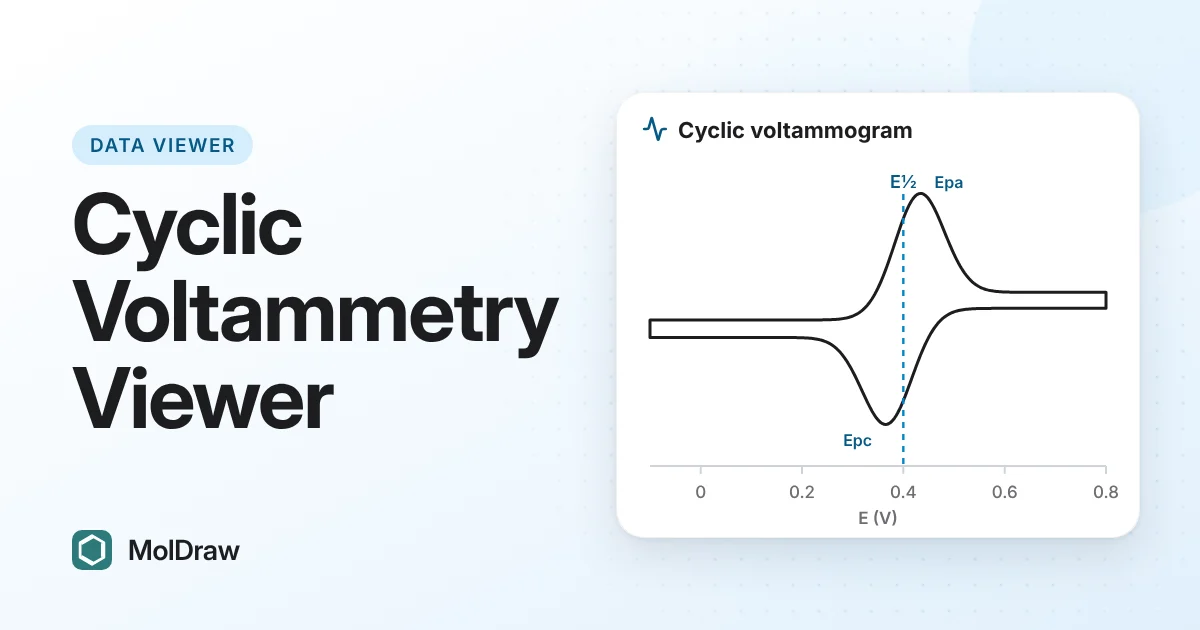
Short answer: Open the cyclic voltammetry viewer, press Open CV file(s) or drop a CSV, CH Instruments, BioLogic, Gamry or Autolab export onto the page. Pick a cycle and read Epa, Epc, E½, ΔEp and ipa/ipc, with a short note on what they mean. The same page converts reference electrodes, estimates HOMO and LUMO from onset potentials and runs a Randles–Ševčík scan-rate analysis. Your files stay on your device.
Try the CV viewer here
Press Ferrocene (reversible) in the live viewer to load a worked example.
Why use a browser CV viewer?
Potentiostat software usually runs on one lab computer and reads one vendor's files, so collaborators often cannot open your data. Reading peaks by hand from a plot is slow and error-prone. The MolDraw viewer reads the common exports, overlays them and measures the standard values the same way every time.
Cyclic voltammetry in brief
The working electrode potential is swept linearly to a vertex and back while the current is recorded. The anodic peak (Epa, current ipa) comes from oxidation. The cathodic peak (Epc, current ipc) comes from reduction.
For an electrochemically reversible couple, E½ = (Epa + Epc)/2 is close to the formal potential. The peak separation ΔEp is about 59/n mV at 25 °C, where n is the number of electrons, and it does not change with scan rate. A ratio ipa/ipc near 1 means both forms are stable during the scan. A wider ΔEp points to slower electron transfer or uncompensated resistance. A missing return peak means the product reacts away.
A potential only has meaning against a reference electrode. Aqueous work often uses SCE or Ag/AgCl. In organic solvents, IUPAC recommends reporting potentials against the ferrocene/ferrocenium couple (Fc/Fc+) measured in the same cell.
For organic semiconductors, the onset potentials of oxidation and reduction vs Fc/Fc+ give rough frontier orbital energies: E(HOMO) ≈ −(Eox, onset + 4.8) eV, and the same with the reduction onset for LUMO. The 4.8 eV value is a convention, not a constant.
The Randles–Ševčík equation links peak current to scan rate. For a reversible wave of a dissolved species at 25 °C, ip = 2.69 × 10⁵ n3/2 A D1/2 C v1/2. So ip grows with √v. For a species fixed on the electrode, ip grows with v instead.
Files the viewer opens
| CSV or TXT | Potential and current columns, with optional time and cycle columns. Current units (A, mA, µA, nA) are read from the header. |
|---|---|
| Instrument exports | CH Instruments text exports, BioLogic EC-Lab .txt exports, Gamry .DTA files and Autolab NOVA ASCII exports. |
| Scan rate | Read from the header or a time column, or typed in mV/s next to the file name. |
| Cycles | Taken from a cycle column, or found from the turning points of the sweep. |
How to analyse a CV step by step
- Press Open CV file(s), or drop files on the box. To explore first, press an example such as Quasi-reversible or Irreversible oxidation.
- Under Reference and units, set Data vs to the electrode you measured against and Show vs to the one you want to report. If you ran ferrocene in the same cell, type its E½ in Ferrocene E½ vs data ref (V).
- Choose a cycle in the Peaks menu. Read the table and the "What it means" note under it.
- For energy levels, open HOMO / LUMO from onset potentials. Tick Use oxidation onset, Use reduction onset or both, and Mark onsets to see them on the plot.
- For a scan-rate series, select several files at once, or tick Add to the plot instead of replacing. Check each scan rate, open Scan-rate analysis (Randles-Sevcik), and enter Electrons n and Concentration (mM).
- Save your work with Export PNG, Export CSV or ip plot PNG.
What the viewer does
- Overlays: each file gets its own colour. Show, hide or remove files, and choose which cycles to draw.
- Plain-language verdict: the note calls ΔEp up to 75 mV reversible and up to 200 mV quasi-reversible. Peaks more than 0.8 V apart are treated as separate processes, so E½ and ΔEp are not given.
- References and signs: convert between SCE, two Ag/AgCl electrodes, SHE, NHE, Hg/HgO and Fc/Fc+. Oxidation is plotted up (IUPAC); tick US convention to flip it.
- Scan-rate analysis: ipa against √v with a fitted line and R², the slope of log ip against log v, a diffusion or surface verdict, and the diffusion coefficient D when n, area and concentration are set.
- Current density: set Electrode area (cm²) and tick Current density to plot j instead of I.
Ways to use it in class and in the lab
- Teaching reversibility: load Ferrocene (reversible), Quasi-reversible and Irreversible oxidation in turn and compare ΔEp, ipa/ipc and the return peak.
- Reporting a new compound: enter your ferrocene E½ and quote E½ vs Fc/Fc+, which other groups can compare directly.
- Organic electronics: estimate HOMO, LUMO and the electrochemical gap from a film CV, then compare the gap with the optical gap from the UV-Vis spectrum viewer.
- Mechanism checks: run a scan-rate series to tell a diffusing species from one adsorbed on the electrode.
Tips and limits
- Files rarely record the reference electrode, so check Data vs every time.
- The conversions use fixed aqueous values vs SHE. In organic solvents an internal ferrocene standard is more reliable.
- The scan-rate analysis uses the first cycle of each file. D assumes a reversible, diffusion-controlled wave at 25 °C.
- HOMO and LUMO values are estimates. Compare only values made with the same Fc/Fc+ level and the same method (onset or E½).
- With overlapping waves, check that the Epa and Epc markers sit on the peaks you mean.
The tools page lists all the free MolDraw data viewers.
Questions and answers
Why is my ΔEp larger than 59 mV for a couple that should be reversible?
Uncompensated resistance and slow electron transfer both widen ΔEp. Run ferrocene in the same cell. If it also shows a large ΔEp, the cell is the cause.
Can I report potentials vs Fc/Fc+ if I measured against Ag/AgCl?
Yes. Set Data vs to your Ag/AgCl electrode, type the ferrocene E½ measured in the same cell, and set Show vs to Fc/Fc+. Without it, the viewer assumes +0.40 V vs SCE (acetonitrile), which is only approximate.
How many files do I need for the scan-rate analysis?
At least three CVs at different scan rates. If a file does not give its scan rate, type it in mV/s next to the file name.
Does the viewer handle files with several cycles?
Yes. Pick the cycle to analyse in the Peaks menu and tick which cycles to show on the plot.