Read and Compare IR Spectra in Your Browser
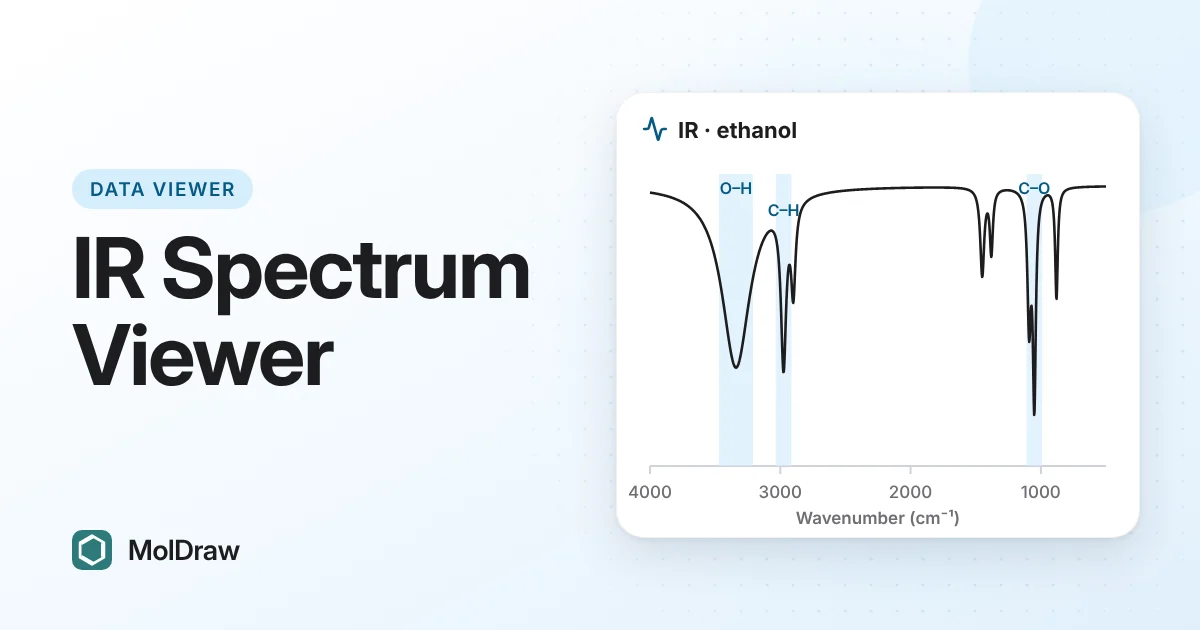
Short answer: Open the free MolDraw IR viewer and drop in a JCAMP-DX, CSV/TXT or SPC infrared file. Switch between %T and absorbance, correct a sloping baseline, pick peaks and read the likely functional group for each one. You can overlay a second spectrum and export a PNG or CSV. The file is read in your browser and is not uploaded.
Try the IR viewer here
Why use a browser IR viewer?
IR is often the quickest check in an organic lab. Did the ester form? Is the starting alcohol gone? The answer is in a few bands, but the spectrum usually arrives as a file from the FTIR software, and that software is only on the instrument PC.
A browser viewer lets you open that file anywhere, find the peaks and see which groups they fit. You can also put two spectra on one plot to see what changed during a reaction.
What an IR spectrum tells you
Bonds absorb infrared light at frequencies that depend on bond strength and atom mass. The x axis is wavenumber in cm−1, drawn from high to low.
%T and absorbance show the same data. Transmittance T is the fraction of light that passes through. Absorbance is A = −log10(T). In %T, bands point down. In absorbance, they point up, and band height scales with concentration (Beer–Lambert law). That makes absorbance the better choice for comparing intensities.
Key regions to learn first:
- O–H: a broad band near 3200–3550 cm−1 in alcohols. Carboxylic acids show a very broad O–H that runs from about 3300 down to 2500 cm−1.
- C–H: just below 3000 cm−1 for sp3 carbons, just above 3000 cm−1 for alkene and aromatic C–H.
- C≡N and C≡C: near 2100–2260 cm−1, where little else appears.
- C=O: a strong band near 1650–1800 cm−1. Esters sit near 1735–1750, ketones near 1715 and amides lower, near 1650–1690.
- C–O: strong bands near 1000–1300 cm−1 in alcohols, ethers and esters.
Below about 1500 cm−1 is the fingerprint region. It is unique to each compound but hard to assign band by band.
Bonds that barely change the dipole, such as the C=C of a symmetric alkene, give weak IR bands or none. They are often strong in Raman, so when an expected band is missing here, clean up and read a Raman spectrum of the same sample.
Which files it opens
| JCAMP-DX | .jdx, .dx or .jcamp files, including compressed data. |
|---|---|
| CSV or TXT | Two columns: wavenumber and intensity. |
| SPC | Thermo/Galactic SPC in the common new format. Old-format and multi-x SPC files are not supported; save those as JCAMP-DX or CSV. |
The viewer works out whether your y values are %T, transmittance (0–1) or absorbance. An x axis in micrometres is changed to cm−1.
How to work through a spectrum
- Press Open IR file or drop the file on the box. To practise, press Ethanol or Benzoic acid.
- Choose %T or Absorbance for the y axis.
- If the background slopes or curves, tick Baseline correction. The plot is then labelled Baseline corrected.
- Move the Threshold slider until the real bands are picked and the noise is not, then press Pick peaks. Choose Add peak to add a weak band by hand.
- Read the peak table. Each row gives the wavenumber, strength, best match with its usual range and reason, and other options. Tap a row to shade its band on the plot.
- To compare, press Open 2nd file or pick from or an example…. Press Swap to make the second trace the main one.
- Export with Export PNG, Export CSV or Peak list CSV.
What the viewer does
| Y axis | %T or absorbance, converted with A = −log10(T). |
|---|---|
| Baseline | Rubber-band baseline fitted in absorbance and subtracted. |
| Peaks | Automatic picking with a threshold, Add peak by tapping, and strength marked s, m or w. |
| Groups | Best match and other options for each peak from the same correlation table as the IR spectroscopy chart. Matches that fail a whole-spectrum check are marked possible. A summary lists the groups that look present. |
| Compare | Overlay a second file or example in a different colour, Swap, or Remove 2nd. |
| Export | PNG of the plot, CSV of the data in the current y mode, and a peak list CSV with assignments. |
Ways to use it in class and in the lab
- Teaching labs: after an esterification, students open their product and check for an ester C=O near 1740 cm−1 and a strong C–O band. The Ethyl acetate example shows what to look for.
- Reaction checks: overlay product and starting material. A lost O–H band or a new C=O band is easy to see on one plot.
- Teaching group frequencies: load Ethanol, Acetone and Benzoic acid in turn to compare an alcohol, a ketone and a carboxylic acid.
- Reports: export a PNG and the peak list CSV for a results table.
Tips and limits
- Group hints are a starting point, not an assignment. Check each one against the structure you expect.
- A low threshold picks noise and water vapour bands. Raise it, then add weak bands you trust by hand.
- Baseline correction changes band heights. Say so if you report a corrected spectrum.
- For SPC files with several subfiles, only the first is read.
- IR alone rarely proves a structure. Use it with NMR and mass spectra.
New to IR? Our guide on how to read an IR spectrum walks through each region with examples.
Questions and answers
Should I show %T or absorbance in a report?
Both are common. Organic chemistry reports often use %T, with peaks pointing down. Absorbance is better when you compare band heights, because it scales with concentration. Label the axis so readers know which one you used.
Will the viewer tell me what my compound is?
No. It suggests a functional group for each peak and checks those groups against the rest of the spectrum. It does not name compounds. Use NMR and mass spectra to work out a structure.
Why is the region below 1500 cm-1 hard to assign?
This fingerprint region holds many overlapping bending and skeletal bands. It is very useful for matching a sample to a known reference, but single bands there rarely prove a functional group on their own.
How can I show that a reaction worked?
Open the product as the main spectrum and the starting material under Compare with. Look for bands that appear or disappear, such as a new C=O stretch near 1700 cm-1 after an alcohol is oxidised to a ketone.