View, Integrate and Clean Up NMR Spectra in Your Browser
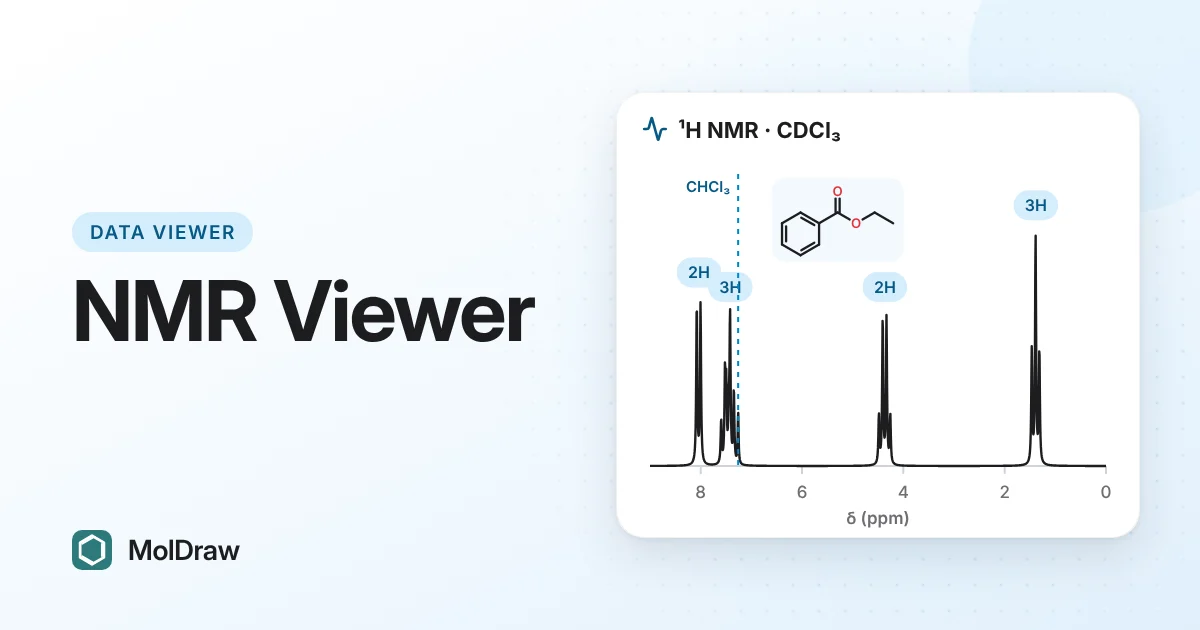
Short answer: Open the free MolDraw NMR viewer and drop in a JCAMP-DX, CSV/TXT or Bruker 1H or 13C file. You can zoom, pick peaks, integrate, reference the shift scale to the solvent, find common solvent and grease peaks, and export a PNG, CSV or JCAMP-DX file. The file is read in your browser and is not uploaded.
Try the NMR viewer here
Why use a browser NMR viewer?
Most NMR data is processed in licensed software on the spectrometer PC. That is less handy when you want to check a spectrum at home or on a laptop without a licence.
A browser viewer fills that gap. Open the exported file, read the shifts, check the integrals and see whether the "extra" peaks are just ethyl acetate or grease. Then save a clean figure for a lab report.
What a 1H or 13C spectrum tells you
Chemical shift (δ, ppm) shows the electronic environment of a nucleus. Aromatic protons sit near 7–8 ppm, protons next to oxygen near 3.5–4.5 ppm and alkyl protons below about 2 ppm. Because ppm is a ratio, the same compound gives the same shifts on a 60 MHz or a 600 MHz magnet.
Splitting comes from coupling to nearby protons and is measured in Hz. A CH2 next to a CH3 shows as a quartet. The Hz width of a multiplet does not change with field, so it spans more ppm on a low-field benchtop magnet.
Integration is the area under a 1H signal. It is proportional to the number of protons, so the ratios tell you, for example, that a signal is 2H and another is 3H. In routine 13C spectra the areas are not reliable.
Referencing fixes the zero of the scale. TMS is set to 0 ppm. Most people use the residual solvent peak instead, such as CHCl3 at 7.26 ppm in CDCl3 or DMSO-d5 at 2.50 ppm in DMSO-d6. A wrongly referenced scale can lead to a wrong assignment.
Which files it opens
| JCAMP-DX | .jdx, .dx or .jcamp files, including compressed (ASDF) data. Most NMR software can export this format. |
|---|---|
| CSV or TXT | Two columns: ppm and intensity. |
| Bruker | Processed data: a zip of the experiment folder, or the 1r and procs files picked together. |
If the file holds the spectrometer frequency, the viewer uses it. If not, set it under Spectrometer.
How to work through a spectrum
- Press Open spectrum file or drop the file on the box. To practise first, press Ethyl benzoate in CDCl3.
- Set the field under Spectrometer with the 60 to 800 MHz buttons if your file did not include it. The peak table then gives correct Hz values.
- Under Reference (shift calibration), pick your solvent in the impurity box and press Reference to solvent. If you used TMS, press TMS = 0 ppm. To set any peak by hand, type it in Peak at and should be, then press Apply.
- Zoom into each region. Use the Threshold slider or Pick in view to tidy the peak list.
- Choose Integrate and drag across a signal you know, such as the CH3 triplet. Type 3 in First integral =. Integrate the other signals and read their areas.
- Press Find impurities. Compare the hits with your peaks before you remove anything.
- Export with Export PNG, Export CSV or Export JCAMP-DX.
What the viewer does
| View | Zoom, Pan, + and −, Y+ and Y− for peak height, and Reset view. Scroll and pinch also zoom. |
|---|---|
| Peaks | Automatic picking with a threshold, Pick peak to add by clicking, and a table of δ ppm, Hz and height. |
| Integrals | Drag to integrate. Areas are scaled to the first integral. |
| Referencing | Reference to solvent, TMS = 0 ppm, or click Reference and pick a peak. |
| Impurities | Matches peaks against the trace impurity tables of Fulmer et al. (2010) for 12 deuterated solvents. Lists likely and partial matches with their expected signals. |
| Clean figure | Remove, Remove all likely, Undo, Restore all, and Show original. The plot is marked Edited for display. |
| Export | PNG, CSV and JCAMP-DX of what is on screen. |
Ways to use it in class and in the lab
- Teaching labs: give students a JCAMP-DX file of their product. They reference it, integrate it and report the shifts and proton counts with a figure.
- Field strength demos: load Ethyl benzoate in CDCl3 and then Benchtop 80 MHz. The same multiplets crowd together at low field.
- Purity checks: before you submit a compound, run Find impurities to name the small peaks from work-up solvents, water or grease.
- Checking a prediction: compare your peaks with a predicted spectrum from the SMILES to NMR predictor. For 13C and 2D experiments, predict COSY, HSQC and HMBC spectra with the NMR Analyser plugin.
Tips and limits
- Reference before you run Find impurities. The match uses a small ppm window, so an offset scale gives poor results.
- A match only means a peak sits where an impurity is expected. Check that all of its signals are present and that the multiplets look right.
- Impurity shifts move a little with concentration and temperature. Widen the ± ppm box with care, since more false hits appear.
- The viewer shows 1D spectra. It has no Fourier transform or phase correction, so process the FID first.
- If your browser cannot unzip a Bruker folder, unzip it and pick the
1randprocsfiles together. - Removing peaks is a display edit. Keep the original file as your data.
New to NMR? Our guide on how to read an NMR spectrum covers shifts, splitting and integrals step by step.
Questions and answers
Can I open 13C spectra as well as 1H?
Yes. The viewer reads the nucleus from the file. If the file does not say, it guesses from the ppm range. The impurity table has both 1H and 13C shifts.
Why do my 13C integrals not match the number of carbons?
Routine 13C spectra are recorded with proton decoupling. Carbons relax at different rates and get different NOE boosts, so quaternary carbons often look small. Only trust 13C integrals from a spectrum run under quantitative conditions.
Can I process a raw FID in the viewer?
No. The viewer opens processed spectra: JCAMP-DX, two-column CSV or TXT, and Bruker processed data (the 1r and procs files). Do the Fourier transform and phasing in your spectrometer software first.
Should I hide impurity peaks before I put a spectrum in my thesis?
Keep the original spectrum as your data and report the impurities you found. A cleaned plot is only a display edit. The viewer labels it as edited, and you should say so in the caption if you use it.