Read an Electrostatic Potential Map of Your Molecule with the MEP Plugin
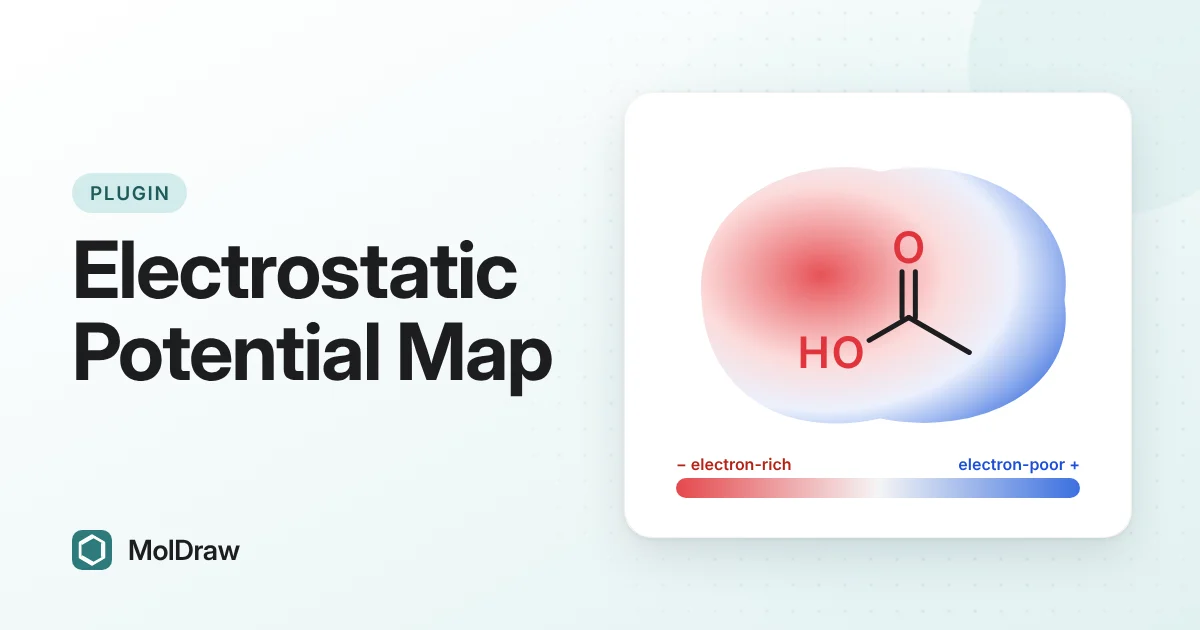
Short answer: Install Electrostatic Potential (MEP) from Settings › Plugins, draw a molecule and open the MEP tab. You get the Gasteiger partial charge of every heavy atom. Press Show in 3D to colour a surface around the 3D model: red is electron-rich, blue is electron-poor. It is an approximate map for comparing regions, not a quantum calculation.
Why look at charge, not just structure?
A skeletal formula hides where the electrons are. Yet charge distribution explains a lot of chemistry: why water is polar, where a hydrogen bond forms, and which carbon a nucleophile attacks.
Textbooks show this with colourful electrostatic potential maps. These usually come from quantum-chemistry software, which takes time to set up and run. The MEP plugin gives you a quick, approximate version of the same picture for any molecule you draw.
What an MEP map shows
The molecular electrostatic potential (MEP) at a point is the energy a small positive test charge would feel there, from all the nuclei and electrons of the molecule. A map shows this value on a surface around the molecule, using colour:
- Red means a negative potential. The region is electron-rich and attracts positive charges, protons and electrophiles. Lone pairs on oxygen and nitrogen are typical red spots.
- Blue means a positive potential. The region is electron-poor and attracts negative charges and lone pairs. Hydrogens on O–H and N–H groups are typical blue spots.
- Pale colours in between are close to neutral, for example most C–H regions.
How MolDraw approximates it
The plugin calculates Gasteiger (Gasteiger–Marsili) partial charges. This method shares charge between bonded atoms according to their electronegativity, step by step, until it settles. It uses only the atoms and bonds, so it is fast and runs in your browser. The charges then colour a solvent-accessible surface around the 3D model.
This is a qualitative picture. It ranks which atoms are more negative or more positive. It does not give potential energies you can quote.
What the plugin shows
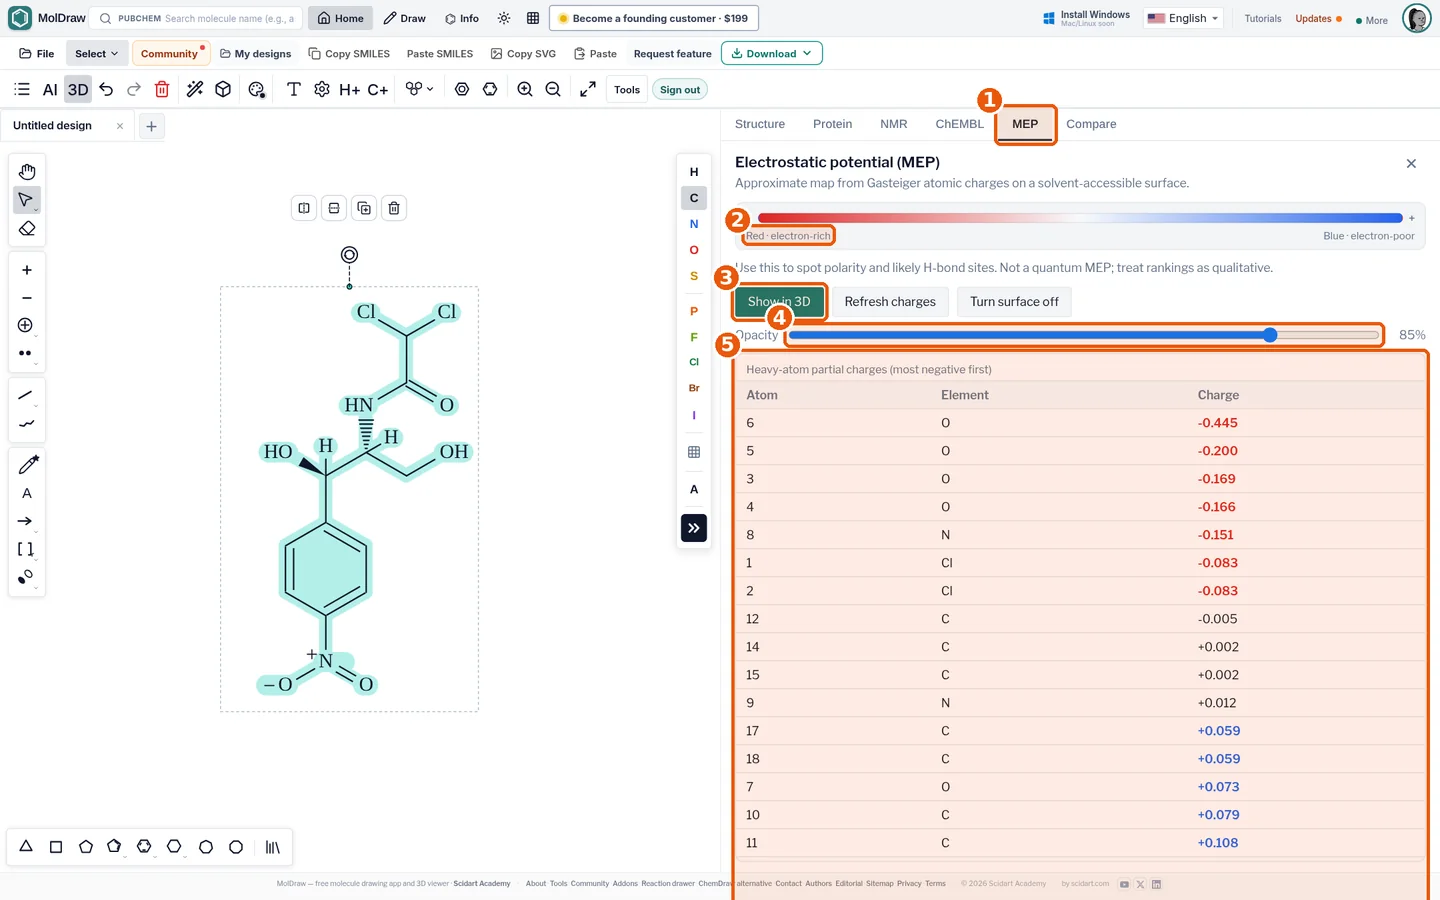
| Colour scale | Red for electron-rich (−) to blue for electron-poor (+). |
|---|---|
| Charge table | Atom number, element and Gasteiger charge for every heavy atom, most negative first. |
| Show in 3D | Paints the charge-coloured surface on the 3D model. |
| Opacity | Makes the surface more or less see-through, so you can see the ball-and-stick model inside. |
| Refresh charges / Turn surface off | Recalculate after you edit the drawing, or go back to the plain 3D view. |
How to install the MEP plugin
- Open the MolDraw editor and sign in. A free account is enough.
- Click Settings (the gear), then Plugins.
- Click Install next to Electrostatic Potential (MEP). An MEP tab appears in the analysis panel.
How to make and read an MEP map
- Draw a molecule, or load one by name with the PubChem search box.
- Open the MEP tab. The charges are calculated straight away.
- Read the top of the charge table. These are the most electron-rich atoms.
- Press Show in 3D. The 3D view opens with the coloured surface.
- Move the Opacity slider until you can see the atoms under the surface. Rotate the model and match each red or blue patch to an atom.
- If you change the drawing, press Refresh charges. Press Turn surface off when you are done.
Ways to use it in class and in the lab
- Polarity: show water, methanol and a hydrocarbon one after another. Students see at once which molecules have strongly coloured regions.
- Hydrogen bonding: red oxygen and nitrogen atoms are likely acceptors; blue O–H and N–H hydrogens are likely donors. To show the lone pairs that make an atom an acceptor, add lone pairs to one atom or the whole molecule.
- Carbonyl reactivity: draw acetone or an ester. The oxygen is negative and the carbonyl carbon is positive, which is where a nucleophile attacks.
- Substituent effects: compare phenol with aniline, or a molecule with and without a nitro group, to see how charge shifts.
- Slides and handouts: a coloured surface makes an abstract idea easy to see in a lecture. For a flat slide where heteroatoms must stand out from the back row, show the 2D drawing as coloured balls and sticks.
Tips and honest limitations
- Compare atoms within one molecule, or across closely related molecules. Do not read the numbers as energies.
- Gasteiger charges depend on the bonds you draw, not on the 3D shape. Rotating a bond does not change them. They also depend on the protonation state you draw, so find the major charged form at your pH with the pKa plugin first.
- Atom-centred charges cannot show every feature of a real potential, such as the electron-rich face of an aromatic ring or the positive cap (σ-hole) on heavier halogens.
- For publication-quality maps, use a quantum-chemistry program. Use this plugin to build intuition and to make quick comparisons.
Building up to charge maps? Start with the Lewis structure generator and the VSEPR geometry calculator.
Questions and answers
What do red and blue mean on an electrostatic potential map?
Red marks electron-rich regions with a negative potential, such as lone pairs on oxygen and nitrogen. Blue marks electron-poor regions with a positive potential, such as hydrogens on O-H and N-H groups. Pale colours in between are close to neutral.
Is the MolDraw MEP a quantum-chemical calculation?
No. It uses Gasteiger partial charges mapped onto a solvent-accessible surface. It is fast and good for comparing regions, but it is an approximation, not a quantum-chemical electrostatic potential.
Why are hydrogen atoms missing from the charge table?
The table lists heavy atoms only and sorts them with the most negative first, so the most electron-rich sites are at the top.
Do I need an account to use the MEP plugin?
Yes. The plugin is free, but you sign in with a free MolDraw account to install it and to compute charges.