Find Protonation States at Any pH with the pKa and Microspecies Plugin
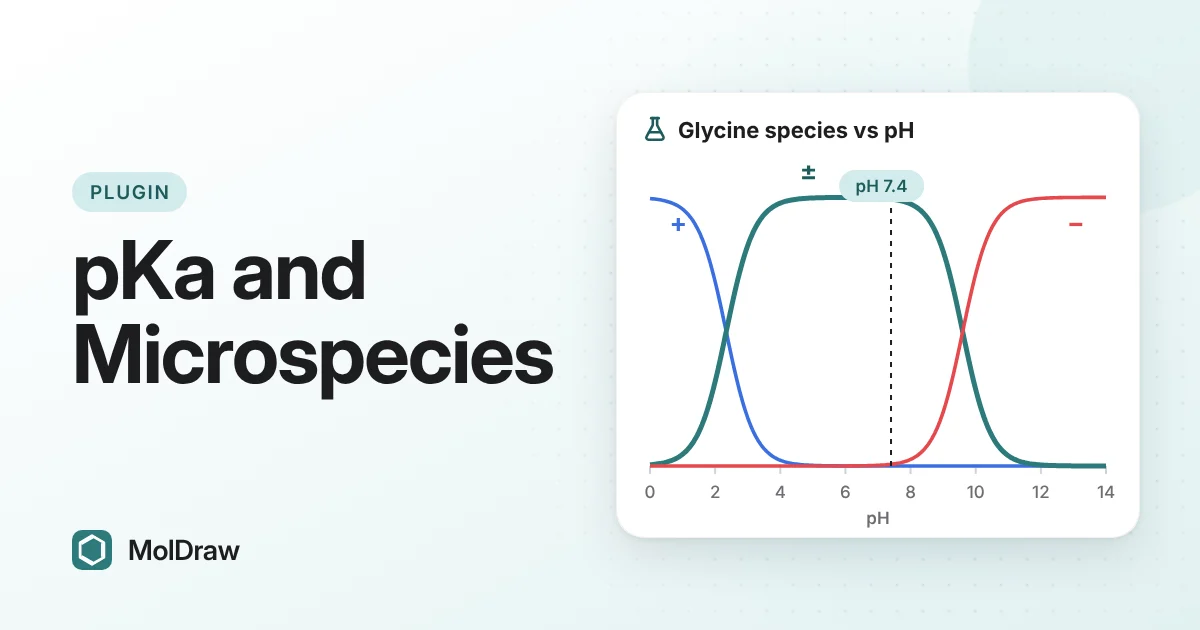
Short answer: Install pKa & Microspecies from Settings › Plugins, draw a molecule and open the pKa tab. Set the pH with the slider or a preset such as Blood 7.4. You see an estimated pKa for each acidic or basic group, the major charged form, the net charge, the isoelectric point and a chart of every microspecies from pH 0 to 14. Everything runs in your browser.
Why the protonation state matters
Most drug molecules carry acidic or basic groups. A carboxylic acid can lose a proton and become a carboxylate. An amine can gain a proton and become an ammonium ion. Which form you have depends on the pH of the solution and on the pKa of each group.
The pKa is the pH at which a group is half protonated and half deprotonated. Each pH unit away from the pKa shifts the ratio between the two forms by a factor of ten. This is the Henderson–Hasselbalch relationship that students meet in general chemistry.
A molecule with several ionizable groups can exist in several protonation states at the same time. Each of these states is a microspecies. The share of each one changes with pH. The form that dominates at blood pH (about 7.4) affects solubility, how easily the molecule crosses membranes and how it binds to a protein. It is also the form you usually want for docking or for a figure. The plugin gives you a quick estimate of all of this while you draw.
What the plugin shows
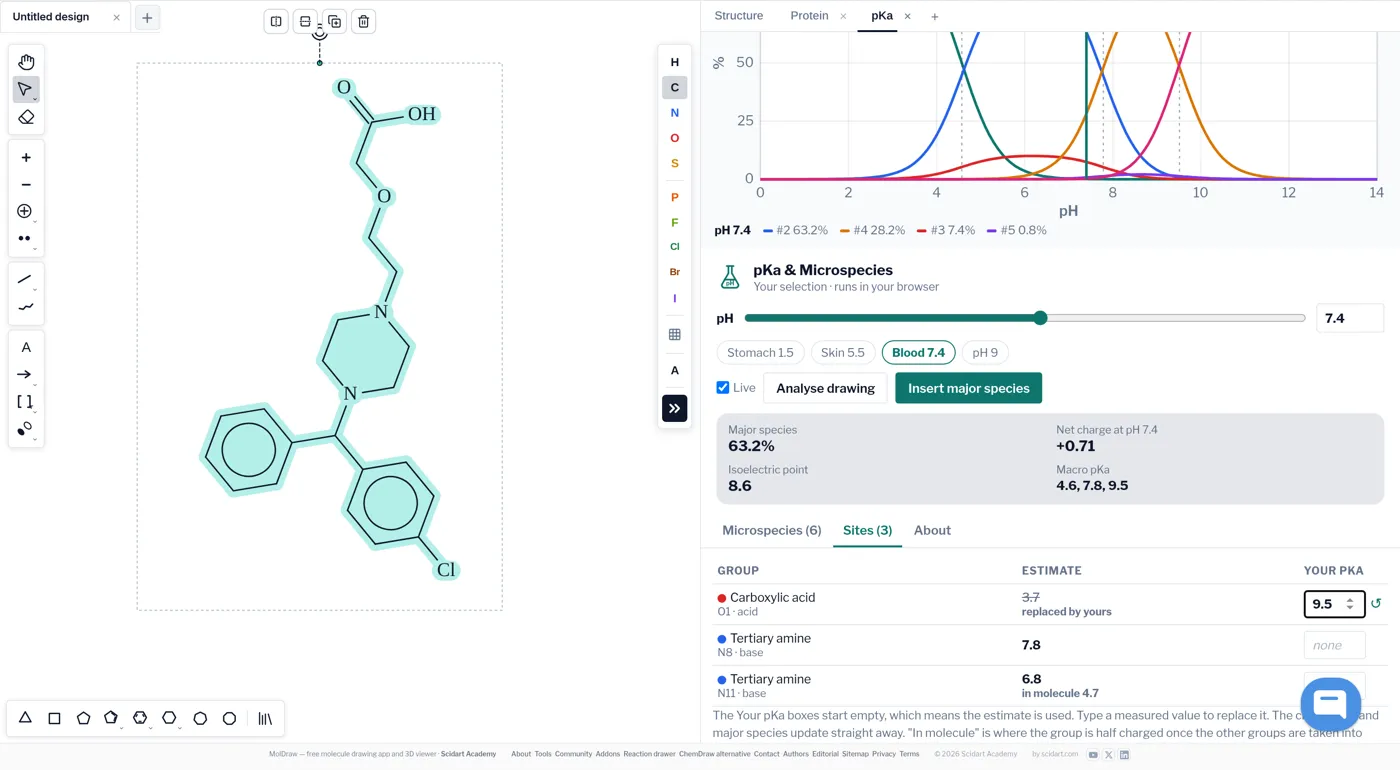
| Structure view | pKa sites labels each acidic or basic group with its estimate. Major at pH draws the main charged form. |
|---|---|
| Chart | The percentage of every microspecies from pH 0 to 14. Click the chart to jump to that pH. |
| pH controls | A slider, a number box and presets: Stomach 1.5, Skin 5.5, Blood 7.4 and pH 9. |
| Summary | Share of the major species, net charge at the chosen pH, isoelectric point and macro pKa values. |
| Tabs | Microspecies lists each form with its charge and percentage. Sites lists each group with its estimate and a box for your own value. About explains the method. |
How to install the pKa plugin
- Open the MolDraw editor and sign in. A free account is enough.
- Click Settings (the gear), then Plugins.
- Click Install next to pKa & Microspecies. A pKa tab appears in the right panel.
You can also right-click a molecule on the canvas and choose pKa & microspecies.
How to find the major species at a given pH
- Draw your molecule. If the canvas holds several molecules, select the one you want.
- Open the pKa tab. With Live ticked, the plugin re-analyses whenever the drawing changes. Otherwise press Analyse drawing.
- Set the pH with the slider, type a value, or press a preset such as Blood 7.4.
- Read the summary: the major species, its share and the net charge.
- Switch the structure view to Major at pH to see where the charges sit.
- Open Microspecies to compare the other forms. Hover over one to highlight its curve on the chart.
- Press Insert major species to add the charged form to the canvas, or Replace drawing to swap your structure for it.
Ways to use it in class and in the lab
- Teaching acids and bases: draw glycine. Textbook values are about 2.3 for the carboxylic acid and 9.6 for the amine, so the zwitterion should dominate at pH 7.4. Compare the plugin's estimates with those values and move the slider to show each form taking over.
- Drug absorption: press Stomach 1.5 and then Blood 7.4 to show how a weak acid or base changes charge along the body.
- Docking and modelling prep: insert the major species at pH 7.4 and export that form rather than the neutral drawing. To see where its charge sits, colour the inserted form by electrostatic potential.
- Quick calculations: for buffer and ratio problems, pair the plugin with the pKa calculator and the pH calculator.
Tips and limits
- Click a pKa label on the structure to jump to that group in the Sites table.
- If you have a measured pKa, type it in the Your pKa box. Leave the box empty to keep the estimate. Measured values beat estimates every time.
- A salt drawn with its counter-ion counts as two molecules. Select the drug part, or draw the neutral parent compound instead.
- If a molecule has no ionizable group between pH 0 and 14, the plugin tells you it stays neutral.
All values are estimates. The plugin finds each acidic or basic group, starts from a measured value for that type of group and adjusts it for nearby substituents with the Hammett and Taft equations. On a held-out test set of about 2,000 molecules the average error is 0.92 pKa units, and 71% of values fall within 1 unit. For common drugs the average error is about 0.45. Some ring systems, tautomers, amidines, enols and C-H acids can be off by 2 units or more. Use the results for teaching, quick checks and planning, not as a replacement for measurement.
Questions and answers
What is a microspecies?
A microspecies is one specific protonation state of a molecule, with each acidic or basic group either carrying its proton or not. A molecule with several ionizable groups can exist as several microspecies at once, and their shares change with pH.
How accurate are the pKa values?
They are estimates. On a held-out test set the average error is 0.92 pKa units, with 71% of values within 1 unit, and about 0.45 units for common drugs. Unusual ring systems and tautomeric heterocycles can be off by 2 units or more.
Does the plugin send my molecule to a server?
No. The calculation runs in your browser and uses no server and no AI model.
Can I use my own measured pKa values?
Yes. Open the Sites tab and type your value in the Your pKa box for that group. The chart, the summary and the major species update straight away.