Get a Quick AI Estimate of NMR, Mass and UV-Vis Spectra with the Spectroscopy Plugin
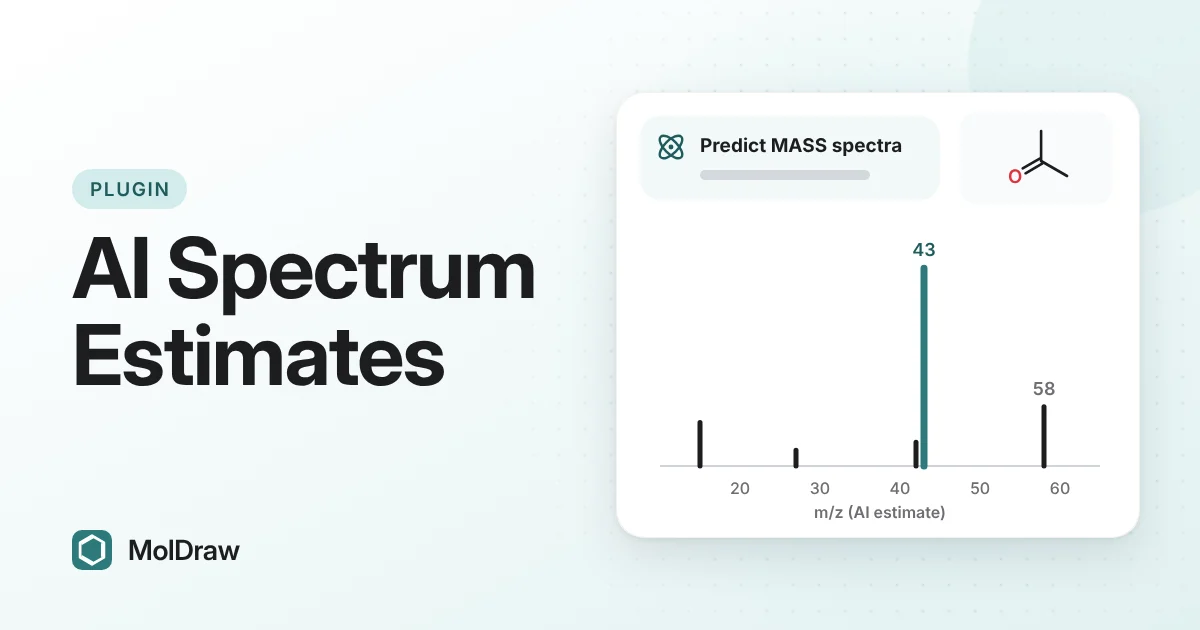
Short answer: Install Spectroscopy from Settings › Plugins and add a Gemini API key in Settings › AI. Draw a molecule, then choose Predict NMR, Predict MASS spectra or Predict UV from the Chemistry menu, or ask the AI chat. You get a chart, a peak table and notes. Treat the numbers as AI estimates and check them against real spectra.
Why predict a spectrum before you measure one?
Spectroscopy problems start with a structure and a question: what should its spectrum look like? A rough prediction tells you where to look and what to expect. It also helps you explain why a signal appears where it does.
Each technique answers a different question:
- NMR shows the chemical environments of nuclei. In a 1H spectrum, the chemical shift (in ppm) reflects the electronic surroundings of each hydrogen, the integral reflects how many hydrogens give the signal, and the splitting reflects neighbouring hydrogens. A 13C spectrum shows the distinct carbon environments.
- EI mass spectrometry hits the molecule with energetic electrons. This removes an electron and forms a radical cation, the molecular ion. Its m/z gives the molecular mass, and the fragment peaks show which bonds break. The tallest peak is the base peak, set to 100.
- UV-Vis measures light absorbed by chromophores such as conjugated π systems and carbonyl groups. More conjugation usually moves the absorption maximum (λmax) to longer wavelength.
The Spectroscopy plugin sends your structure to an AI language model and shows its answer. The values are estimates, not measured data. They are good for learning and discussion. They are not a reference.
What the plugin gives you
| Spectra | 1H and 13C NMR, EI mass spectrum and UV-Vis absorption. |
|---|---|
| Result window | A title, the formula and molecular weight, a stick chart of the peaks, a peak table, notes and a disclaimer. |
| Export | Download PNG saves the chart. Download CSV saves the table. |
| Needs | A free MolDraw account to install it, your own Gemini API key and an internet connection. |
How to install the Spectroscopy plugin
- Open the MolDraw editor and sign in. A free account is enough.
- Click Settings (the gear), then Plugins.
- Click Install next to Spectroscopy.
- Open Settings › AI and paste a Gemini API key. MolDraw stores the key only in your browser.
Without a key, the plugin shows the message "Spectroscopy requires AI. Add a Gemini API key in Settings → AI."
How to predict a spectrum
From the Chemistry menu
- Draw the molecule, or paste a SMILES.
- Open the Chemistry menu in the toolbar and choose Spectroscopy.
- Pick Predict NMR (1H), Predict MASS spectra (EI) or Predict UV.
- The result window opens with the chart, table and notes.
- Use Download PNG or Download CSV to keep the result.
From the AI chat
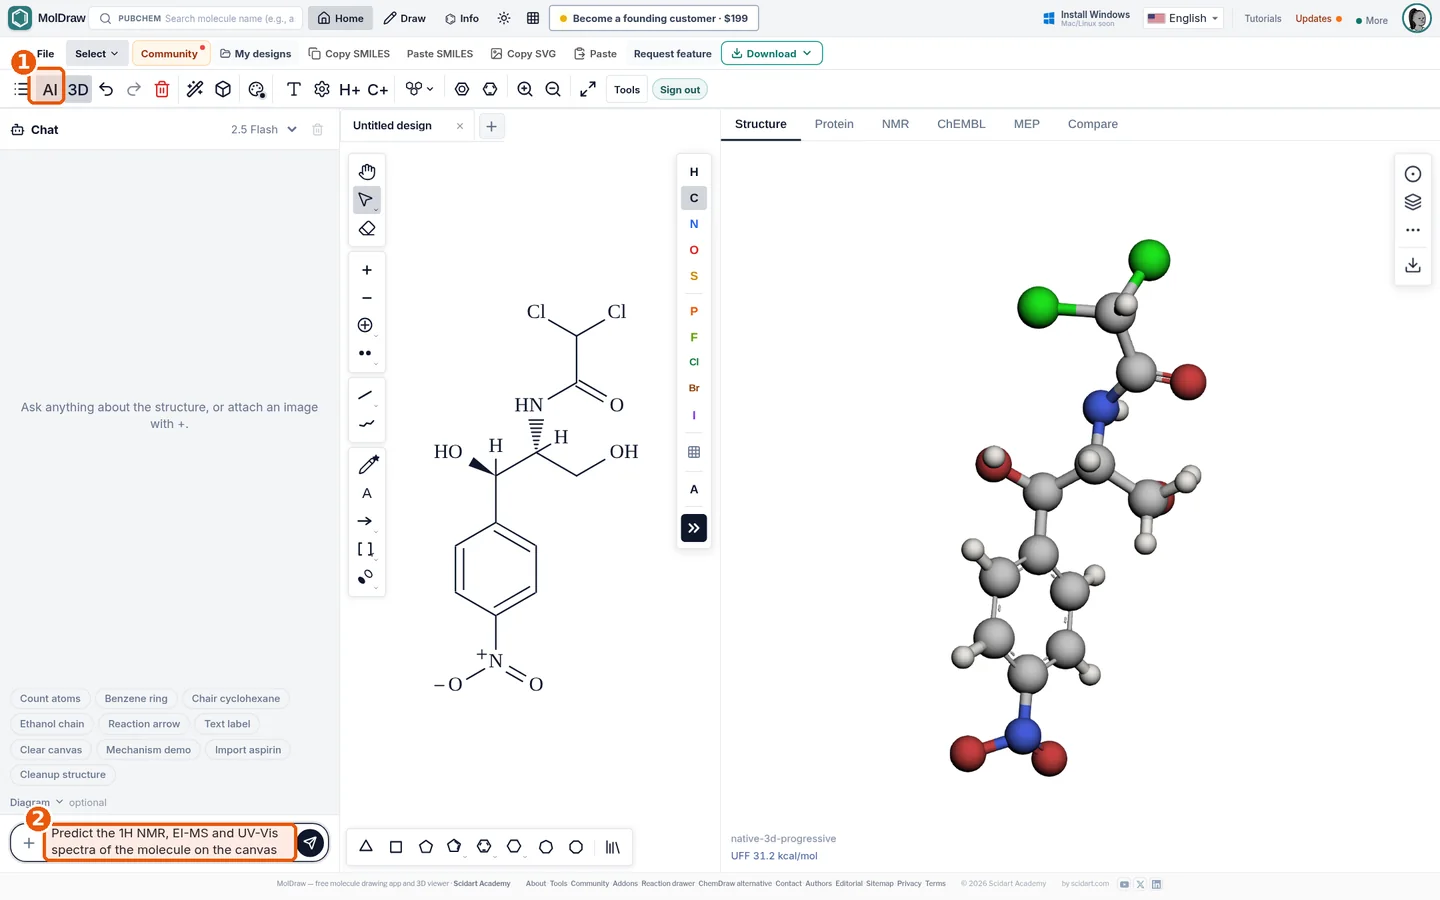
- Click the AI button to open the AI chat.
- Type a request, for example "Predict the 13C NMR spectrum of the molecule on the canvas".
- Ask follow-up questions, such as "Why is the base peak at m/z 43?"
To focus on one part of a larger structure, select those atoms first. MolDraw still sends the whole structure, but asks the model to treat the selection as the fragment of interest.
Ways to use it in class and in the lab
- Practice problems: predict a spectrum, export the chart as PNG and ask students to assign each peak. Then show a real spectrum and discuss where the estimate was off.
- Pre-lab preparation: before you record a spectrum, get a rough idea of where the main signals should fall.
- After the measurement: open your real data next to the prediction. Reference and integrate an NMR spectrum in the browser. Check a mass spectrum against its formula and isotope pattern. Find λmax and ε in a UV-Vis spectrum.
- Before and after a reaction: predict spectra for the starting material and the expected product. Note which signals should appear or disappear, then look for them in your data.
- Explaining fragments: use the chat to ask why a fragment forms. Check the molecular ion with the exact mass calculator.
Tips and honest limits
- Treat every value as an estimate. Compare it with experimental spectra in SDBS or NIST, or with a second prediction from the NMR Analyser plugin.
- The formula and molecular weight in the result window also come from the model. Compare them with the Formula and MW values in MolDraw's status bar.
- The chart draws simple sticks with the x axis increasing from left to right. Printed NMR spectra usually run from high to low ppm. Read exact positions from the table.
- A language model can give slightly different numbers if you run the same request again.
- The model sees only the SMILES and molfile of your drawing. Check stereochemistry, charges and hydrogens before you ask.
Learn to read the plots first: see how to read an NMR spectrum and how to read a mass spectrum.
Questions and answers
Does the Spectroscopy plugin cost money?
No. The plugin is free. Predictions use your own Gemini API key, which has a free tier from Google, and you need a free MolDraw account to install plugins.
Are the predicted spectra accurate enough for a lab report?
No. They are plausible estimates from a language model, useful for learning and explaining. Confirm every value with experimental spectra, for example from SDBS or NIST, before you rely on it.
Which spectra can it predict?
1H and 13C NMR, electron ionisation (EI) mass spectra and UV-Vis absorption bands.
How is it different from the NMR Analyser plugin?
NMR Analyser is a dedicated NMR tool with 1H, 13C and 2D experiments, and it does not need a Gemini key. Spectroscopy asks an AI model for NMR, mass and UV-Vis estimates. Running both gives you two independent views of the same structure.