Predict 1H, 13C and 2D NMR Spectra from Your Drawing with the NMR Analyser
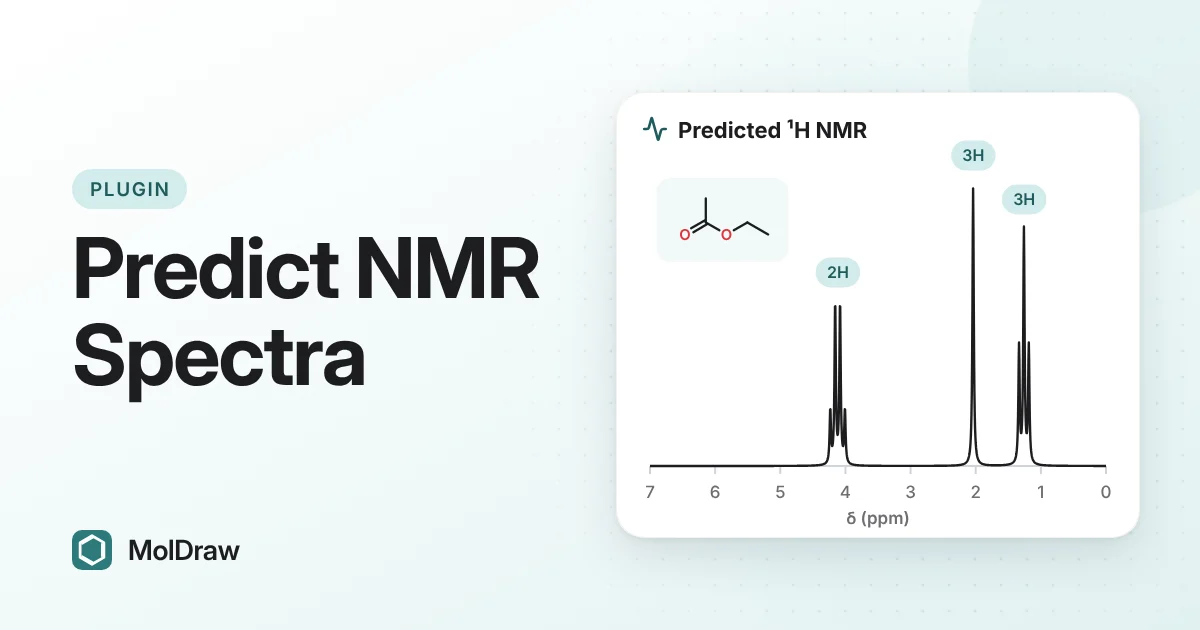
Short answer: Install NMR Analyser from Settings › Plugins, draw a structure, open the NMR tab, choose 1H, 13C, COSY, HSQC or HMBC and press Predict. You get a simulated spectrum with lettered peaks, a signal table with shift, integral, multiplicity and coupling constant, and atom highlights on your drawing. Use it as a guide for assignment, not as a measured spectrum.
Why predict a spectrum before you assign one?
Assigning an NMR spectrum means matching each signal to atoms in a structure. With a real spectrum in front of you, the hard part is knowing where to start. A predicted spectrum gives you a first guess for every signal.
Prediction also helps you check a proposed structure. If the predicted and measured spectra disagree badly, the structure or the assignment needs a second look. Students can practise the same way: predict, compare, then explain each difference.
What each experiment tells you
- 1H NMR: the chemical shift shows the environment of each proton. The integral shows how many protons give the signal. The splitting pattern and coupling constant (J, in Hz) tell you about neighbouring protons.
- 13C NMR: usually one signal for each set of equivalent carbons, spread over a much wider ppm range than 1H. It is a quick way to count carbon environments.
- COSY: cross-peaks link protons that couple to each other, usually through two or three bonds. Use it to walk along a chain of CH groups.
- HSQC: links each proton to the carbon it sits on (one bond).
- HMBC: links protons to carbons two or three bonds away. It joins fragments across quaternary carbons and heteroatoms.
A common route is: read the 1H spectrum, use HSQC to put each proton on its carbon, use COSY to build spin systems, then use HMBC to connect them. New to the basics? Read how to read an NMR spectrum first.
What the plugin shows
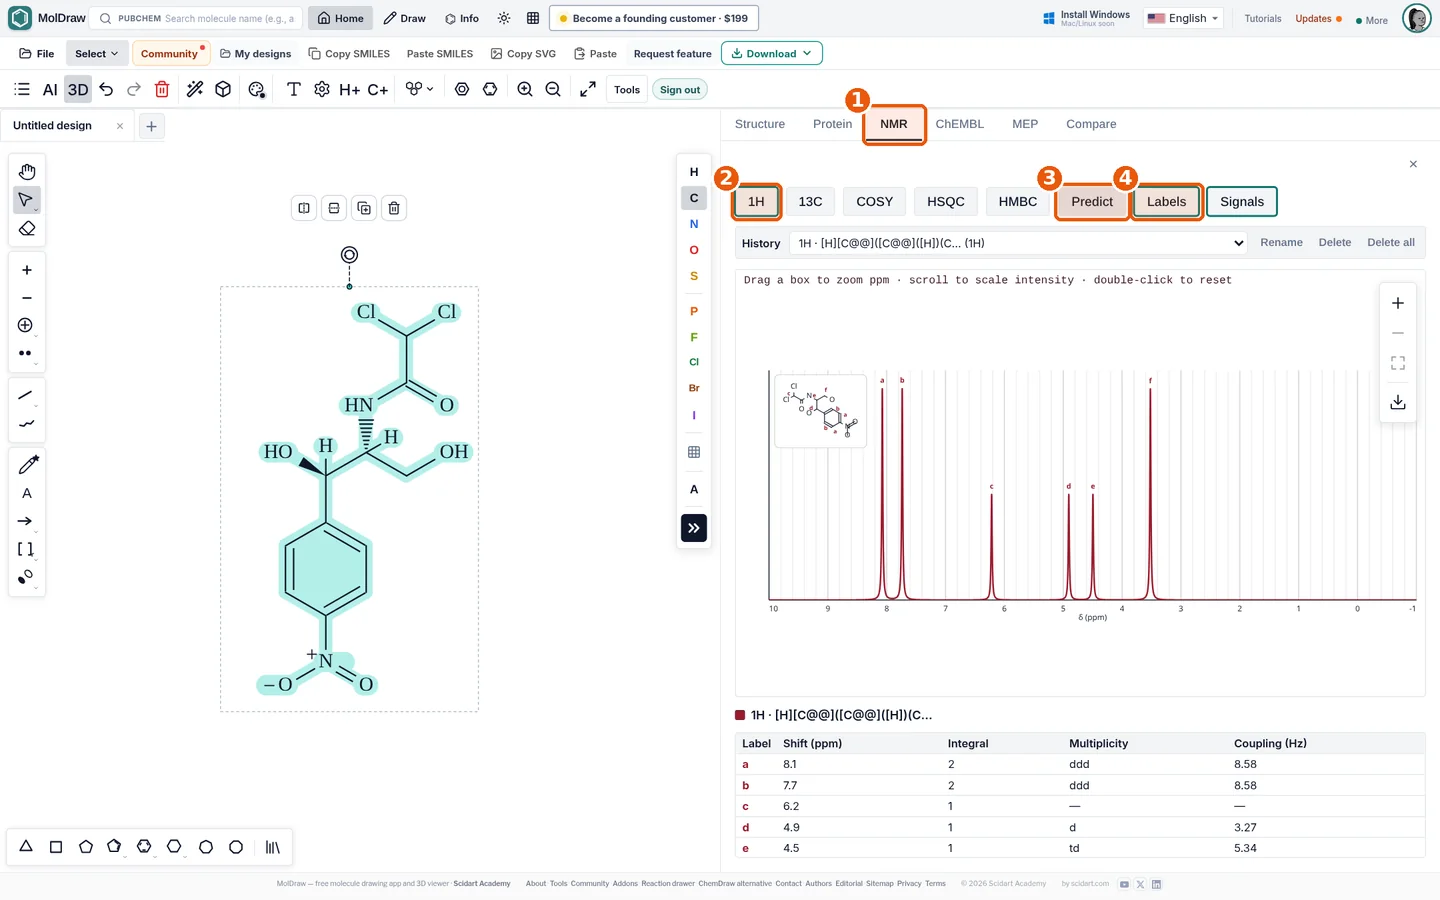
| 1D spectra | 1H and 13C plots with lettered peaks. Turn on Labels to match letters to atoms on the structure. |
|---|---|
| Signals | Label, shift (ppm), integral, multiplicity and coupling (Hz) for each signal. Hover a row to highlight its atoms on the canvas. |
| 2D spectra | COSY, HSQC and HMBC as contour plots. |
| Spectrometer | Presets from 60 to 800 MHz, or a custom value up to 1200 MHz. |
| History and Overlay | Every prediction is kept in History. Overlay several 1D predictions to compare them. |
| Download | PNG or SVG of the plot, or the spectrum data as CSV. |
How to install the NMR Analyser
- Open the MolDraw editor and sign in. A free account is enough.
- Click Settings (the gear), then Plugins.
- Click Install next to NMR Analyser. An NMR tab appears in the analysis panel.
How to predict and use a spectrum
- Draw your structure, or paste a SMILES with Paste SMILES.
- Open the NMR tab and choose an experiment: 1H, 13C, COSY, HSQC or HMBC.
- Press Predict. A 1D spectrum takes a few seconds; a 2D spectrum can take longer.
- Set Spectrometer to the field of your instrument, so the multiplets look like your real data.
- Drag a box to zoom into a ppm range, scroll to scale peak height, and double-click to reset.
- Turn on Labels and Signals. Hover a row to see which atoms it belongs to.
- Use the download button to save the plot or the data.
Ways to use it in class and in the lab
- Lab reports: predict the spectrum of your product, then compare it with the one you measured. Explain any signal that moved. To prepare the measured file, reference, integrate and pick peaks in the browser NMR viewer.
- Isomer problems: predict two candidate isomers, overlay their 1H spectra and look for the signals that tell them apart.
- Teaching splitting: switch between 60 MHz and 600 MHz. The same J in Hz covers more ppm at low field, so multiplets look wider and overlap more. This explains why benchtop spectra look crowded.
- 2D practice: predict HSQC and HMBC for a small molecule and let students connect the fragments themselves.
- Worked examples: export SVG plots for slides and handouts.
Tips and honest limitations
- Predictions come from nmrdb.org: the Spinus model for 1H and nmrshiftdb2 data (HOSE codes) for 13C. They need an internet connection.
- The predictor has no solvent option. OH and NH shifts in particular change with solvent, concentration and temperature.
- Draw stereochemistry where it matters. Diastereotopic protons can give different predicted shifts.
- Replace R groups and attachment points (*) with real atoms. The predictor works best on neutral organic molecules, so remove metals and salts.
- A prediction is a hypothesis. Confirm assignments with your own data, especially 2D spectra.
No account handy? The free structure to NMR tool gives a quick prediction without signing in.
Questions and answers
How accurate is a predicted NMR spectrum?
For common organic molecules it is a useful guide, but it is not a measurement. Exchangeable OH and NH protons and unusual ring systems can differ more, and the predictor has no solvent option. Always confirm an assignment against your experimental spectrum.
Does the NMR Analyser need an account or internet?
Yes to both. You sign in with a free MolDraw account to predict, and each prediction comes from the online nmrdb.org service. Predictions you already made stay in History on your device.
Which 2D NMR experiments can it predict?
COSY, HSQC and HMBC. They are drawn as contour plots, and you can highlight the correlated atoms on your drawing.
Can I export the predicted spectrum?
Yes. The download button saves the plot as PNG or SVG, or the spectrum data as CSV.