Nucleic Acid Builder Add-on: DNA, RNA and Aptamers Step by Step
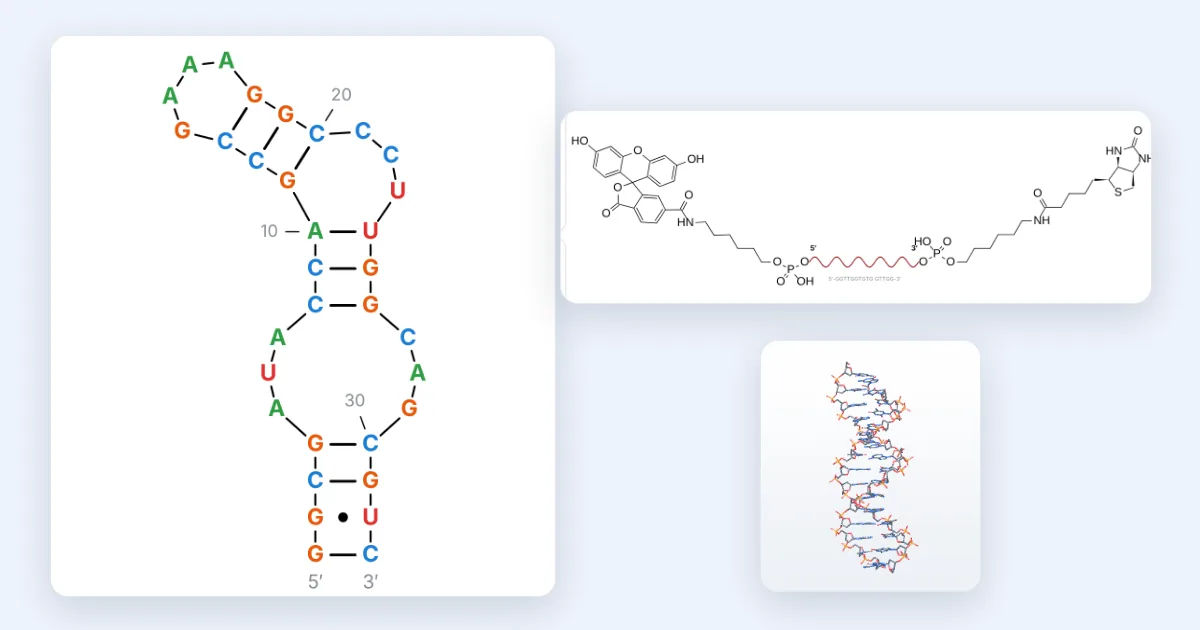
Short answer: Open the 3D viewer, press + and install Nucleic acid builder. In the DNA/RNA tab, type or paste a sequence 5′→3′, add dyes, linkers or modified nucleotides in Modify, then use Fold for the secondary structure and G-quadruplexes, Structure for the full chemical drawing or a schematic, 3D for an A- or B-form helix, and Properties for mass, Tm and ε260.
How to read the screenshots: each orange number in a picture matches the numbered note under it. Dashed boxes with a magnified panel are zoomed-in details.
Step 1: Install the Nucleic acid builder add-on
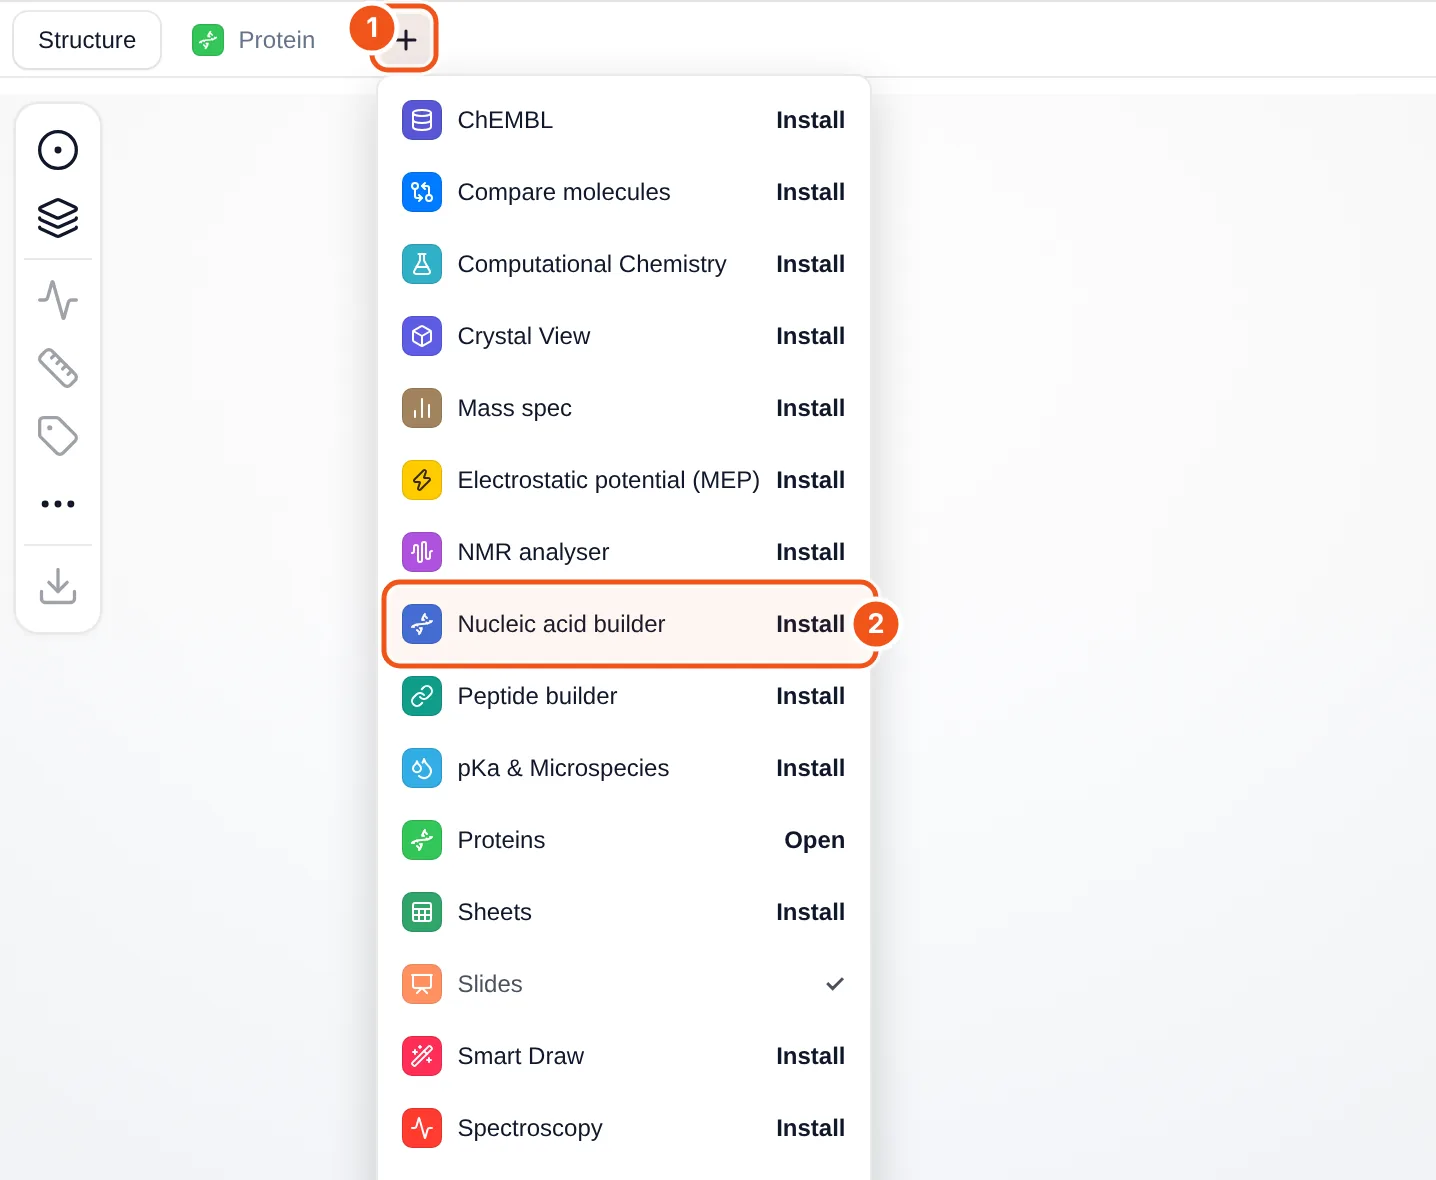
- The + button at the end of the tab row (Structure, Protein, …) opens the add-on menu.
- Nucleic acid builder: click Install and a DNA/RNA tab appears.
- Open the MolDraw editor and sign in. A free account is enough to use add-ons.
- Open the 3D viewer on the right (the 3D button at the bottom of the atom bar) and press + next to the tabs.
- Click Install next to Nucleic acid builder (callout 2). The DNA/RNA tab opens, and the button changes to Open.
Add-ons stay installed on your account. To remove one, hover its tab and click the small ×. You can also manage them under Settings › Plugins.
Step 2: Get to know the DNA/RNA panel
The tab opens with the thrombin-binding aptamer (TBA, GGTTGGTGTGGTTGG) already loaded, so every part of the panel has something to show.
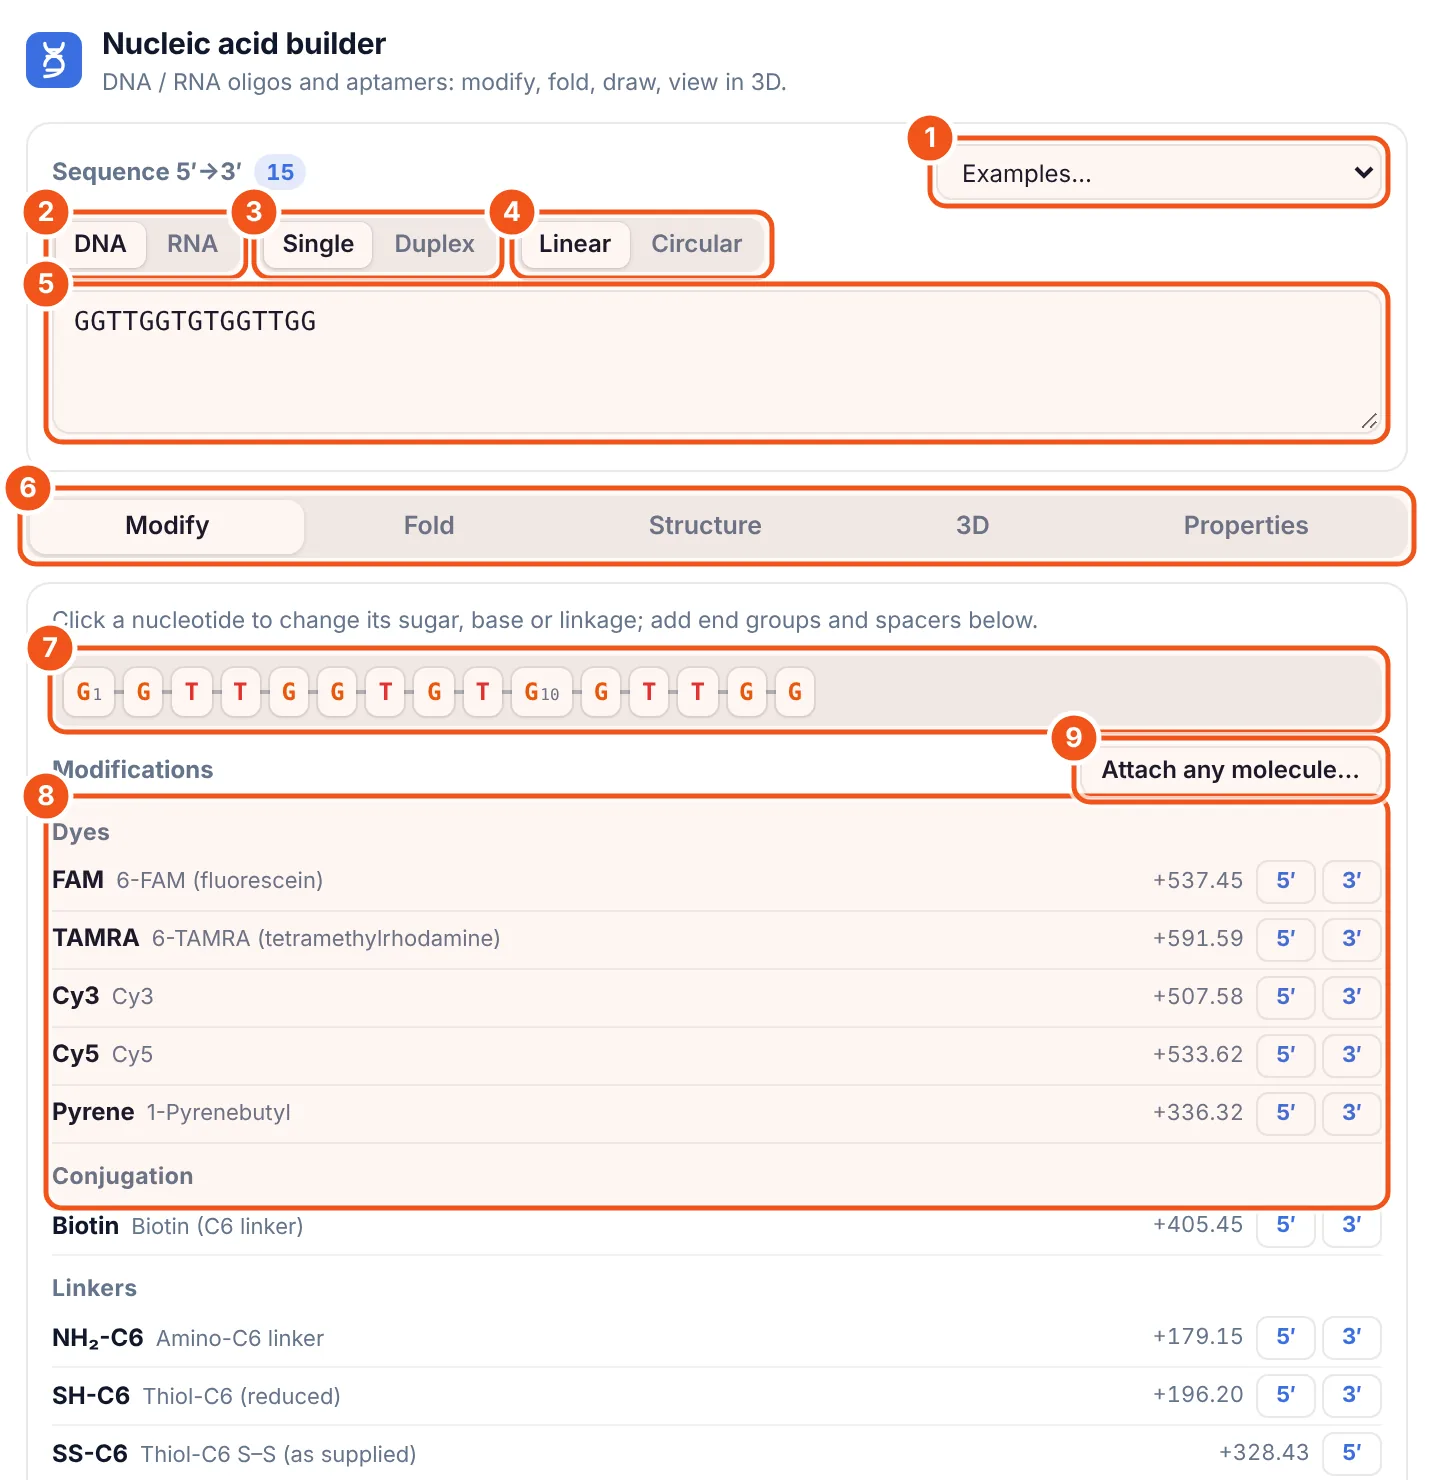
- Examples: TBA, AS1411, sgc8c, the ATP DNA aptamer, the theophylline RNA aptamer and pegaptanib, each with its reference.
- DNA / RNA sets the default sugar (deoxyribose or ribose).
- Single / Duplex: one strand, or the strand with its Watson-Crick complement.
- Linear / Circular: circular joins the 3′ end to the 5′ end.
- Sequence box, always written 5′→3′. Spaces, line breaks, numbers, FASTA headers and 5′-/-3′ marks are ignored.
- The five tabs: Modify, Fold, Structure, 3D and Properties.
- The strand as chips, numbered every 10. Click one to edit that nucleotide.
- Modifications: dyes, conjugation groups, linkers, phosphate and spacers, each with its mass change and 5′ / 3′ buttons.
- Attach any molecule… joins your own structure (from the canvas, PubChem or a SMILES) to the 5′ or 3′ end.
Step 3: Add a label and edit single nucleotides
Click 5′ next to FAM to add a fluorescein label, then click nucleotide 3 and change its 3′ linkage to a phosphorothioate.
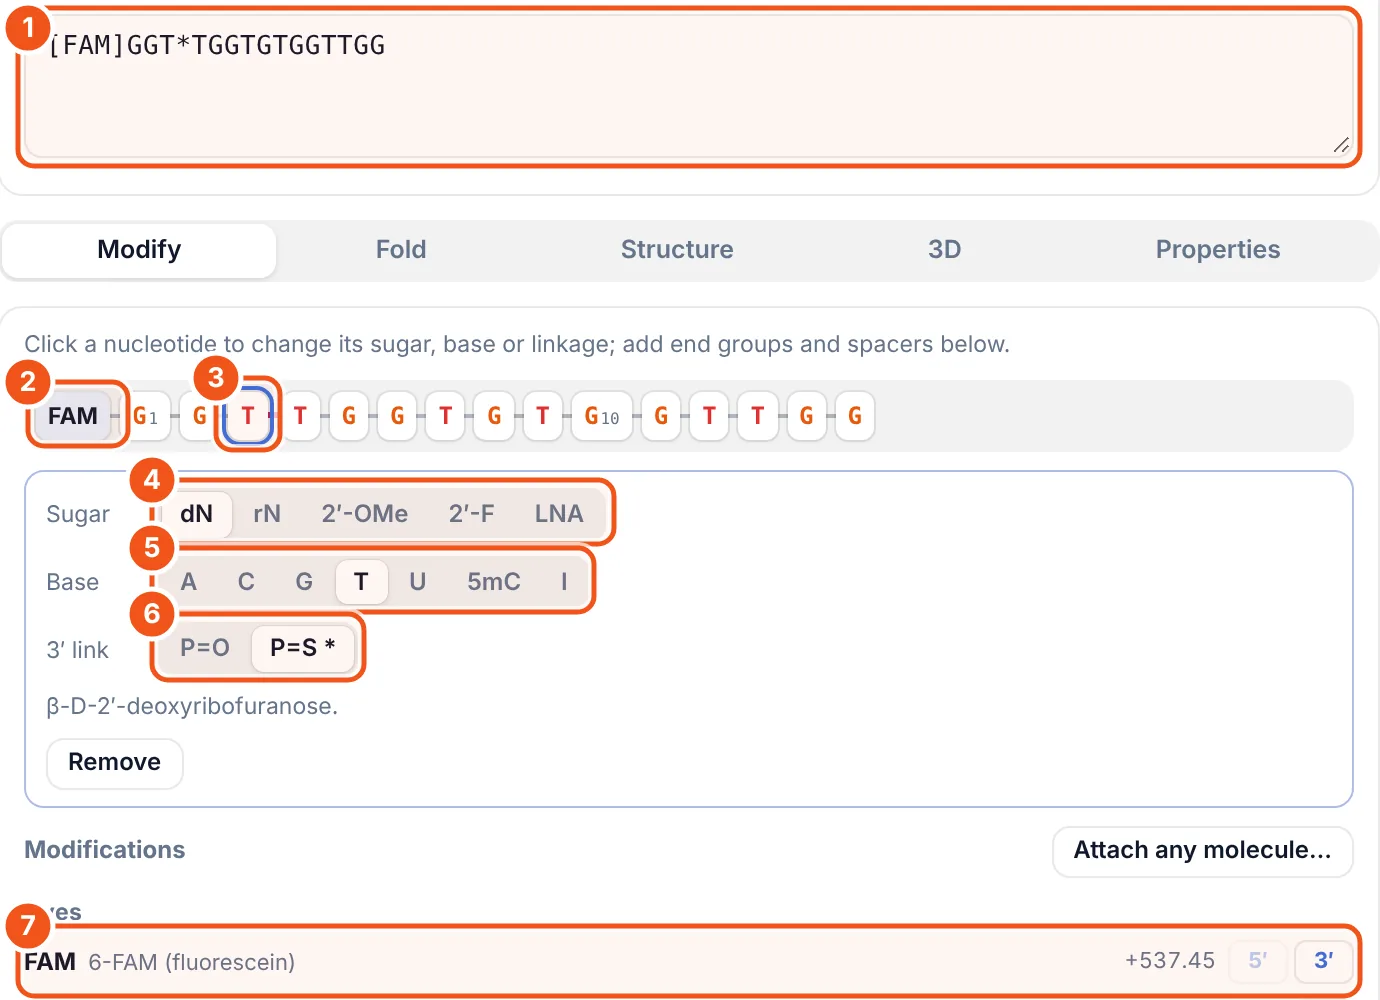
- The text now reads
[FAM]GGT*TGGTGTGGTTGG:[FAM]first means 5′, and*marks the phosphorothioate after T3. - The FAM chip at the 5′ end of the strand.
- Nucleotide 3, selected (outlined in blue).
- Sugar: dN (deoxy), rN (ribo), 2′-OMe, 2′-F or LNA for this nucleotide only.
- Base: A, C, G, T, U, 5-methyl-C or inosine.
- 3′ link: P=O (phosphate) or P=S (phosphorothioate).
- FAM now shows only the 3′ button, because the 5′ end is taken. Each dye row lists its mass change (+537.45 for FAM).
You can also type modifications. mA fC +T rU dA give 2′-OMe, 2′-F, LNA, ribo and deoxy sugars; [5mC] and [I] give 5-methyl-C and inosine; IDT codes such as /56-FAM/ or /3InvdT/ work too.
Step 4: Fold the strand (secondary structure)
Open Fold. Here the theophylline RNA aptamer was picked from Examples because it forms a clear hairpin.
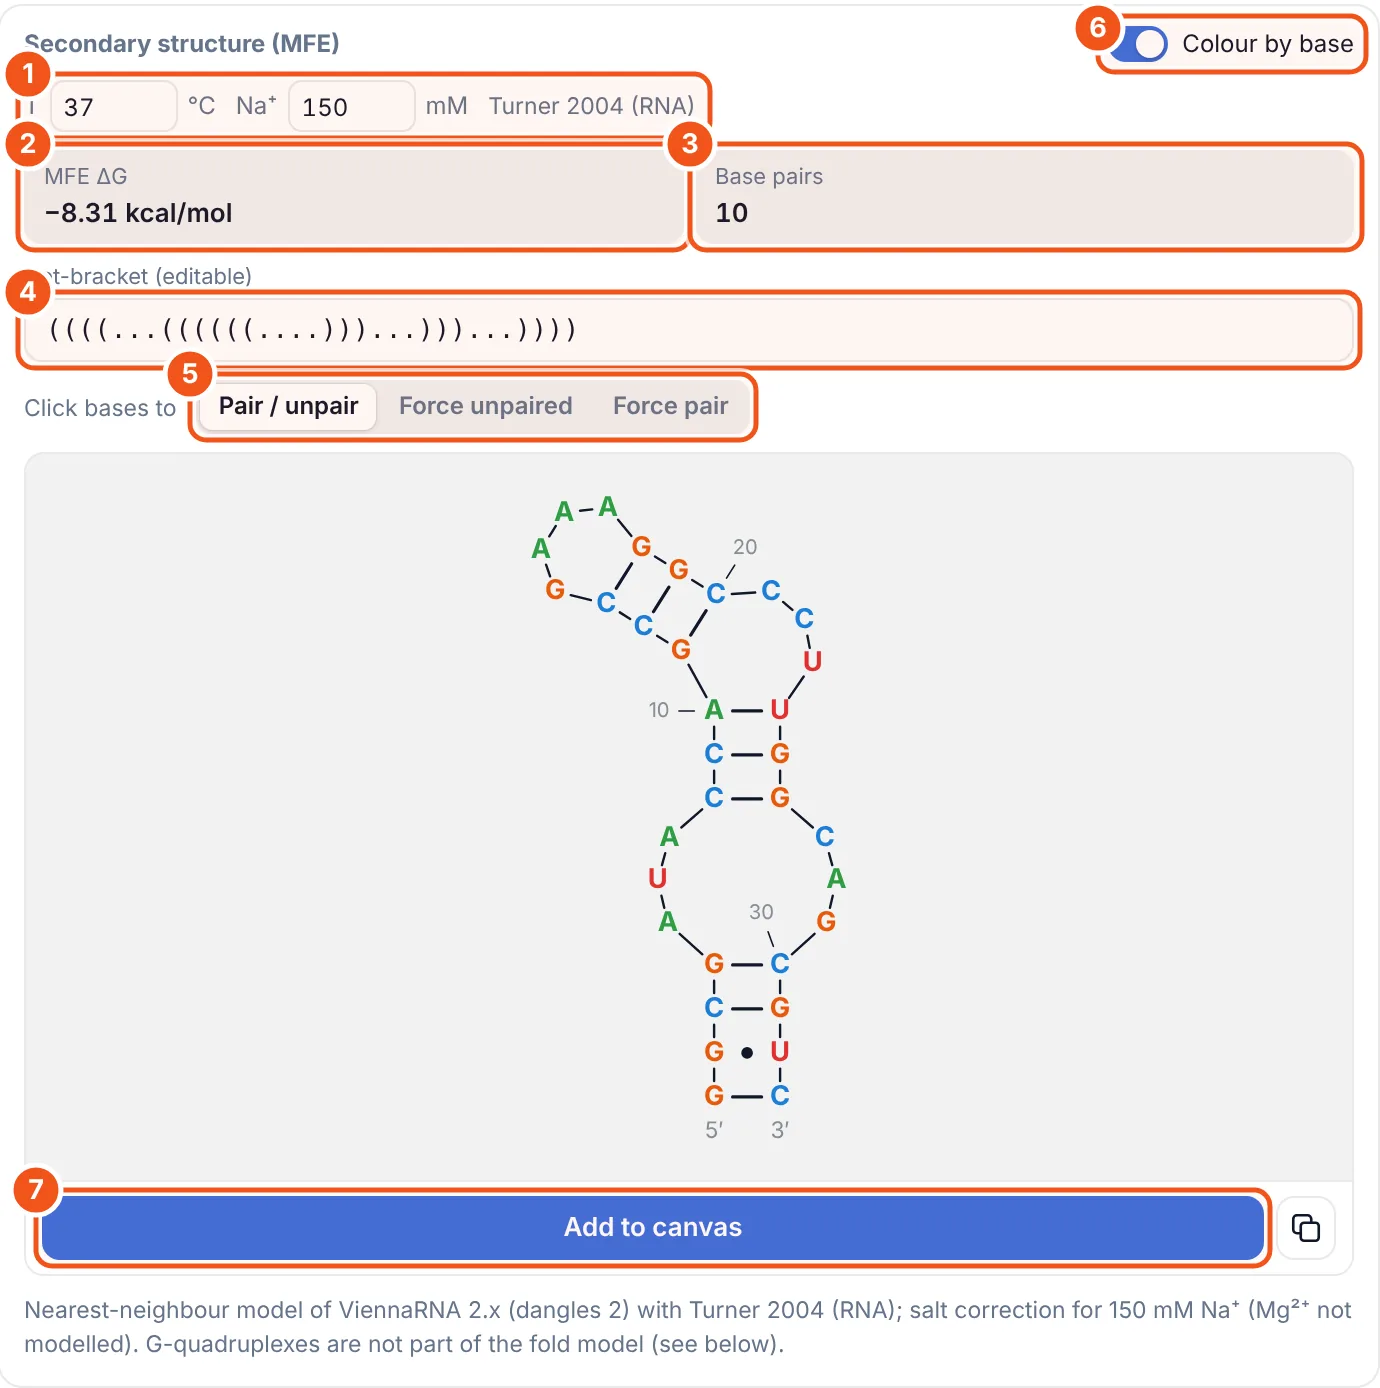
- Temperature and Na⁺ used for the fold, and the energy set (Turner 2004 for RNA, Mathews 2004 for DNA).
- MFE ΔG: −8.31 kcal/mol for this aptamer at 37 °C.
- Base pairs: 10.
- Dot-bracket: brackets are pairs, dots are unpaired bases. It is editable: type your own structure to draw it.
- Click bases to pair or unpair them, force a base unpaired, or force a pair; the fold is recalculated with your constraints.
- Colour by base on or off.
- Add to canvas puts the diagram on your drawing.
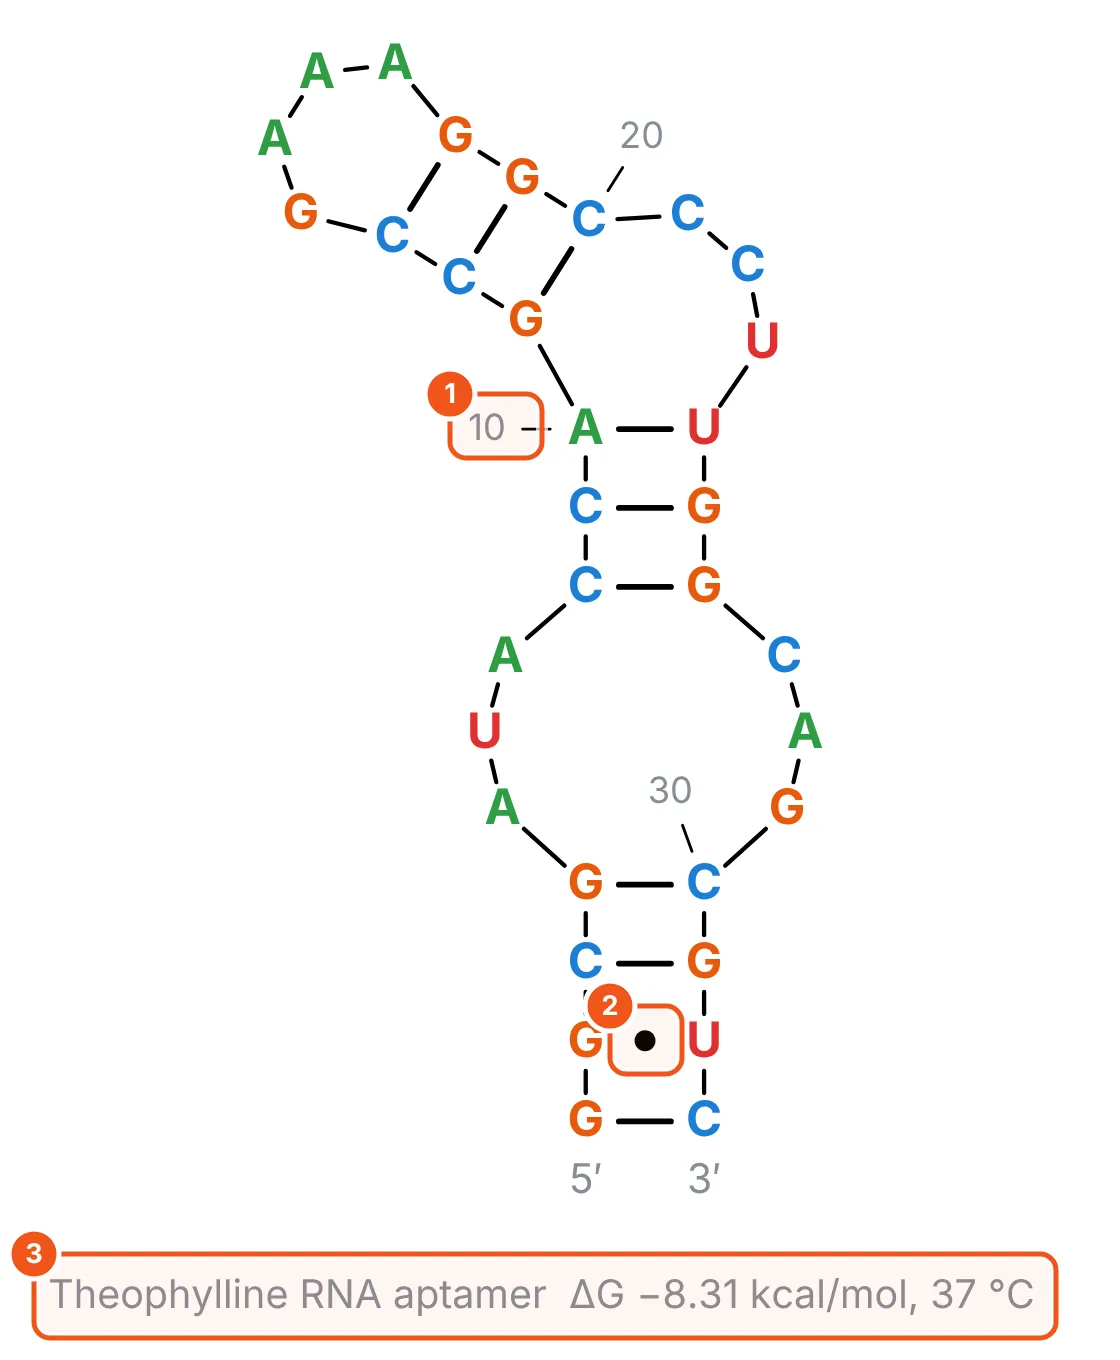
- Numbering every 10 nucleotides.
- A G·U wobble pair, drawn as a dot. Watson-Crick pairs are lines.
- The title with the name, ΔG and temperature, as editable canvas text.
The fold engine reproduces RNAfold (ViennaRNA 2.8): 40 out of 40 test sequences gave the same energy and the same structure. Modified nucleotides fold as their parent bases, and the panel lists what it left out.
Step 5: Check for a G-quadruplex
Guanine-rich aptamers often fold into G-quadruplexes, which the base-pair fold cannot show. Scroll down the Fold tab to the G-quadruplex card. TBA is the classic example.
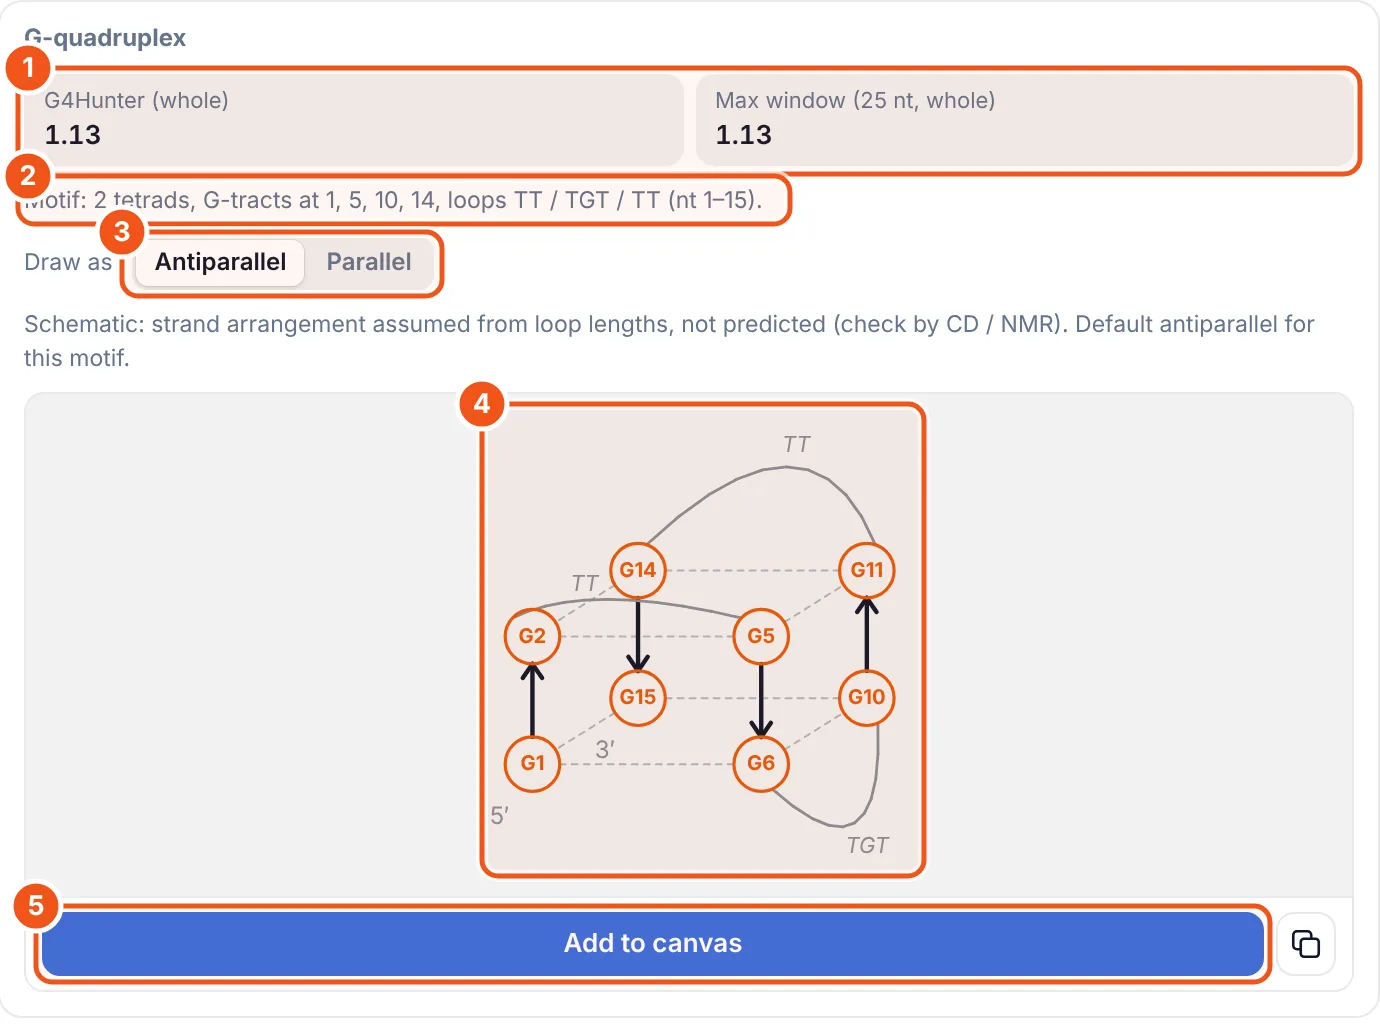
- G4Hunter scores for the whole strand and the best 25-nt window. Above about 1.2 a quadruplex is likely.
- The motif found: number of tetrads, where the G-tracts start and the loop sequences.
- Draw as antiparallel or parallel. The default comes from the loop lengths and is labelled as an assumption, not a prediction.
- The schematic: tetrads G1·G6·G10·G15 and G2·G5·G11·G14, with arrows for strand direction.
- Add to canvas inserts the schematic as an editable drawing.
Step 6: Draw the full chemical structure
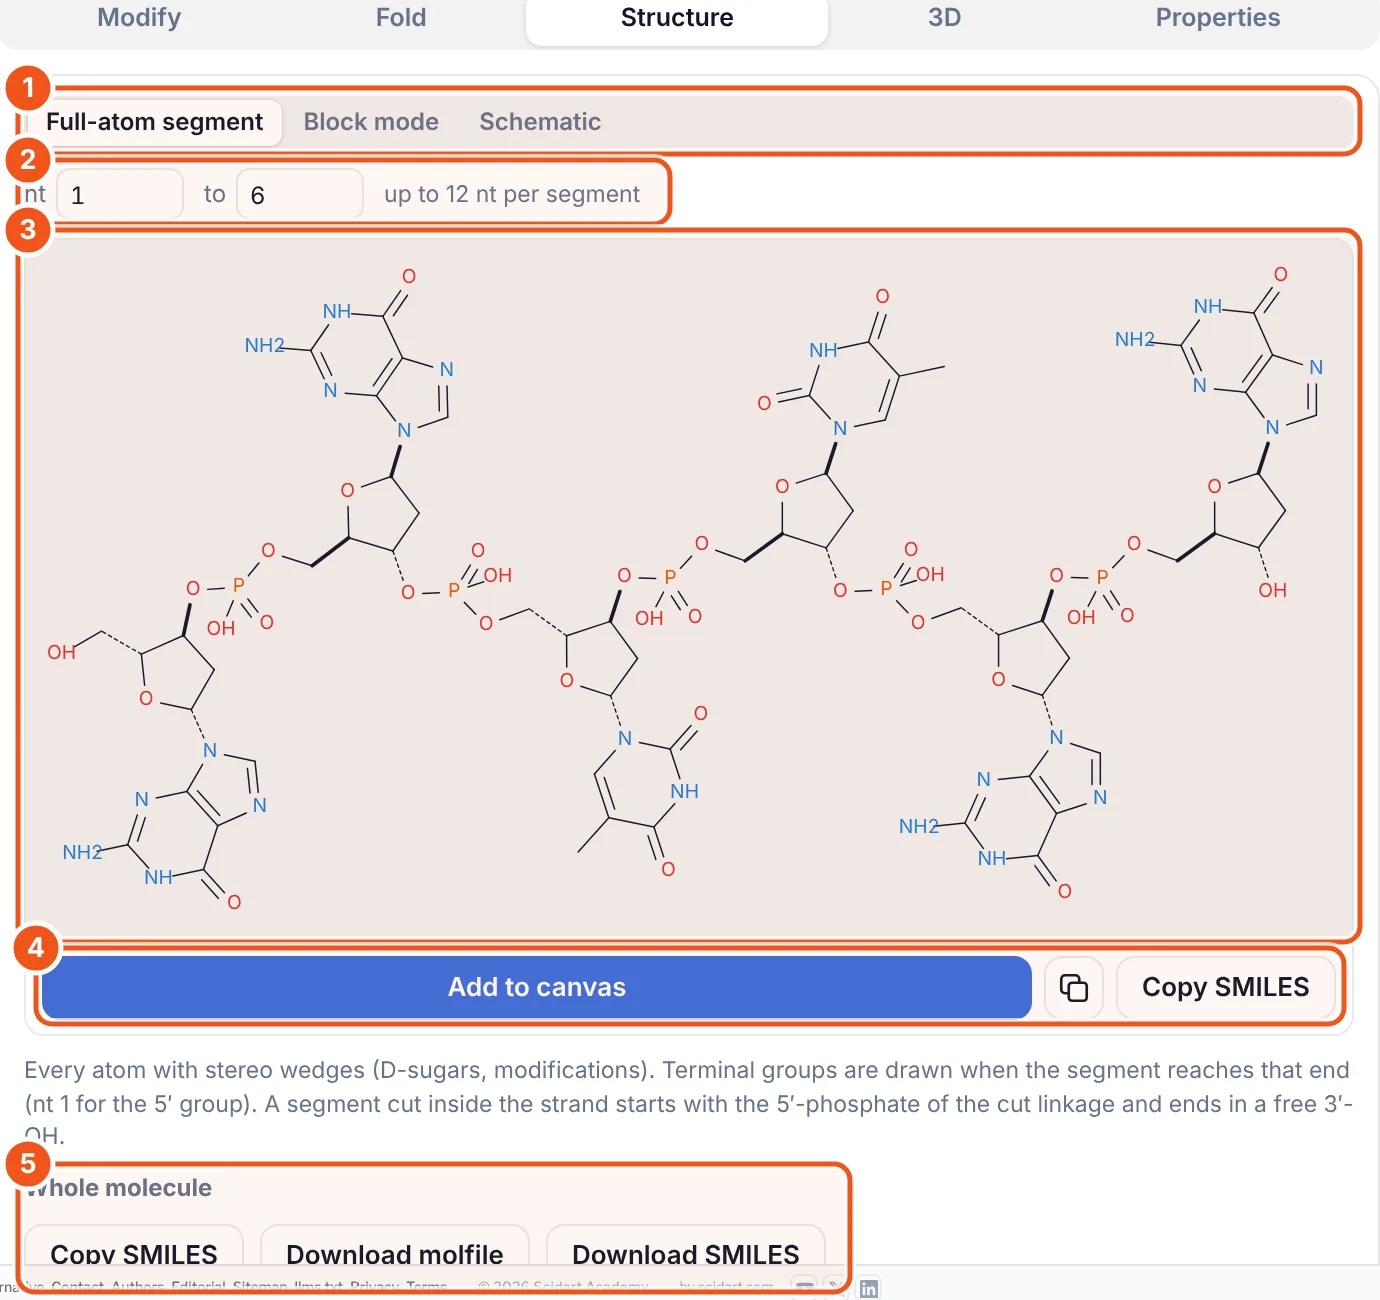
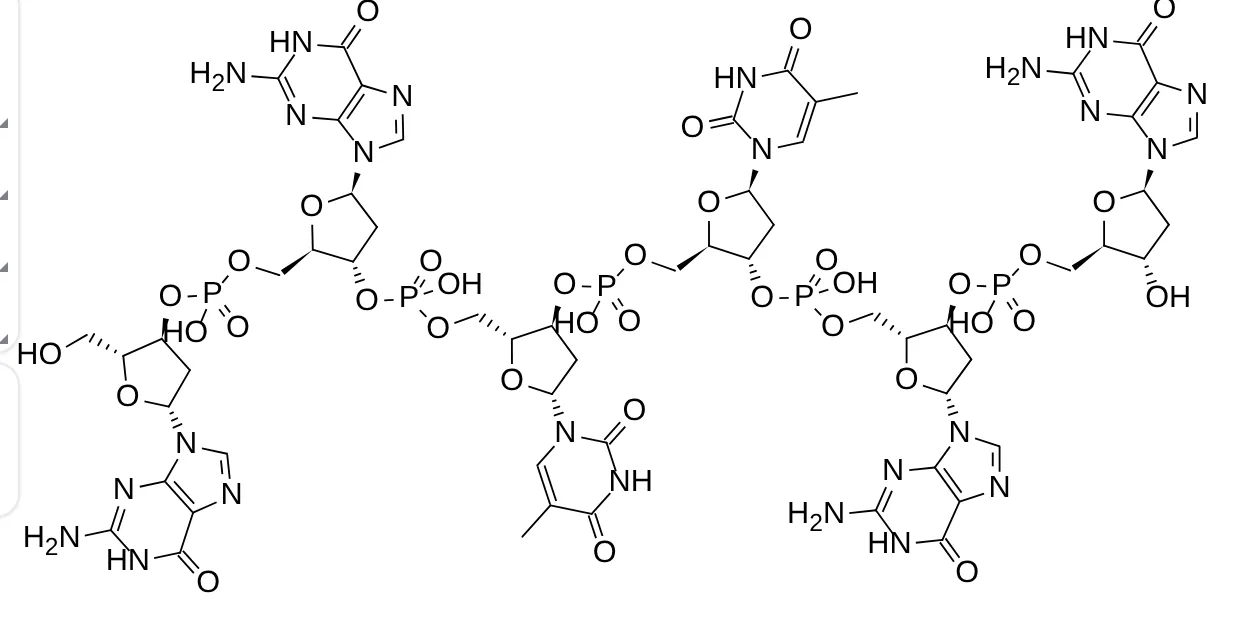
- Three ways to draw: Full-atom segment, Block mode (one labelled box per unit) and Schematic.
- Which nucleotides to draw: here 1 to 6. Up to 12 per segment.
- The preview, exactly as it will be inserted.
- Add to canvas, copy as an image, or Copy SMILES for the segment.
- Whole molecule: copy or download the SMILES or molfile of the full strand at any length.
Step 7: Make a publication figure with Schematic
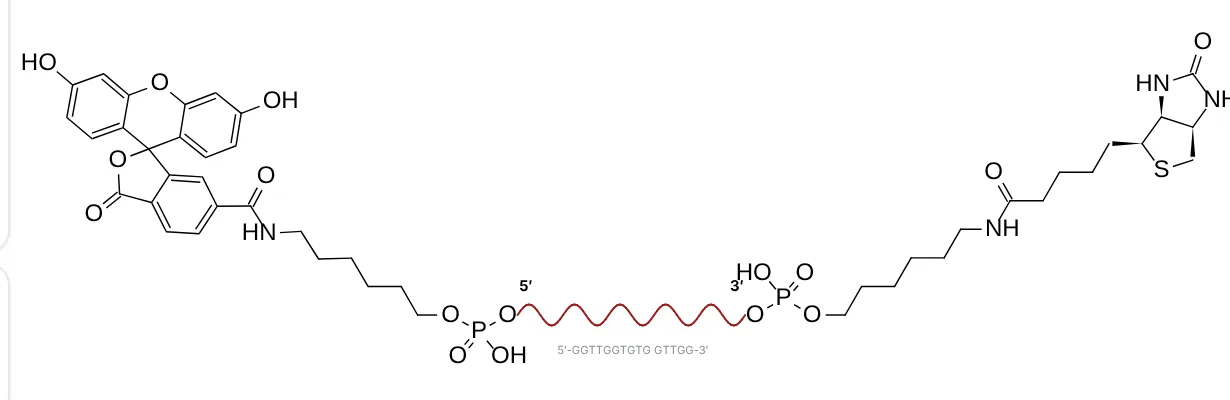
For a labelled aptamer the full structure is too large to read. Schematic mode draws the end groups in full and the oligo as one wavy line. Here the sequence was typed as [FAM]GGTTGGTGTGGTTGG[Biotin].
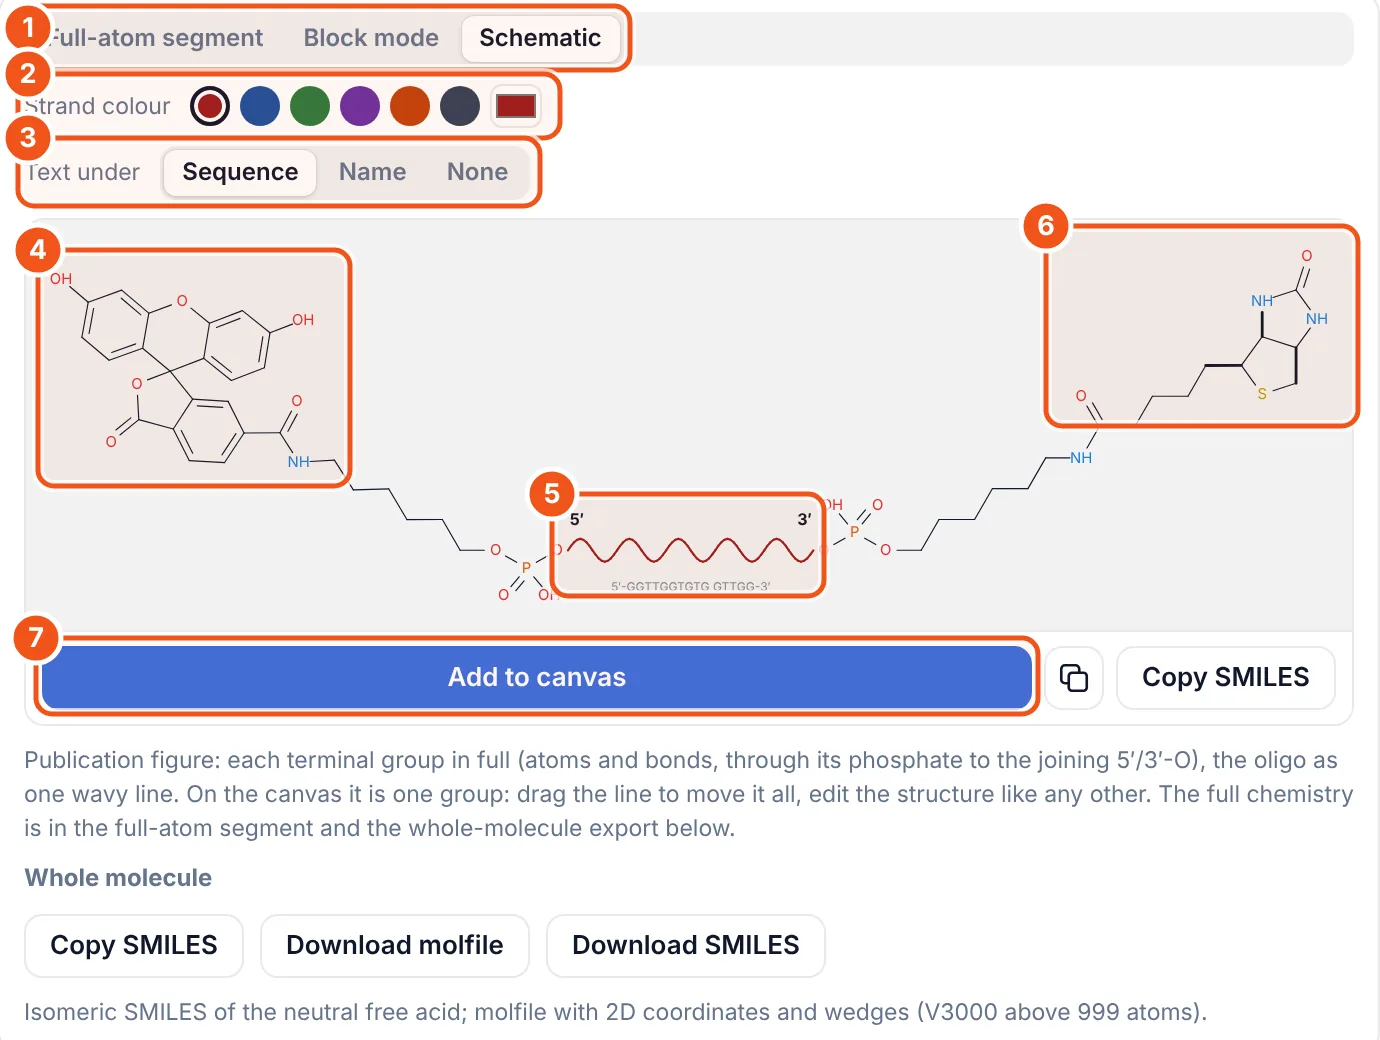
- Choose Schematic.
- Strand colour: six presets or any colour.
- Text under the line: the sequence, the name, or nothing.
- The 5′ group in full, through its linker and phosphate to the oligo (6-FAM on a C6 amino linker).
- The oligo as a wavy line with 5′ and 3′ marks.
- The 3′ group in full (biotin on a C6 linker).
- Add to canvas.
Step 8: View it in 3D
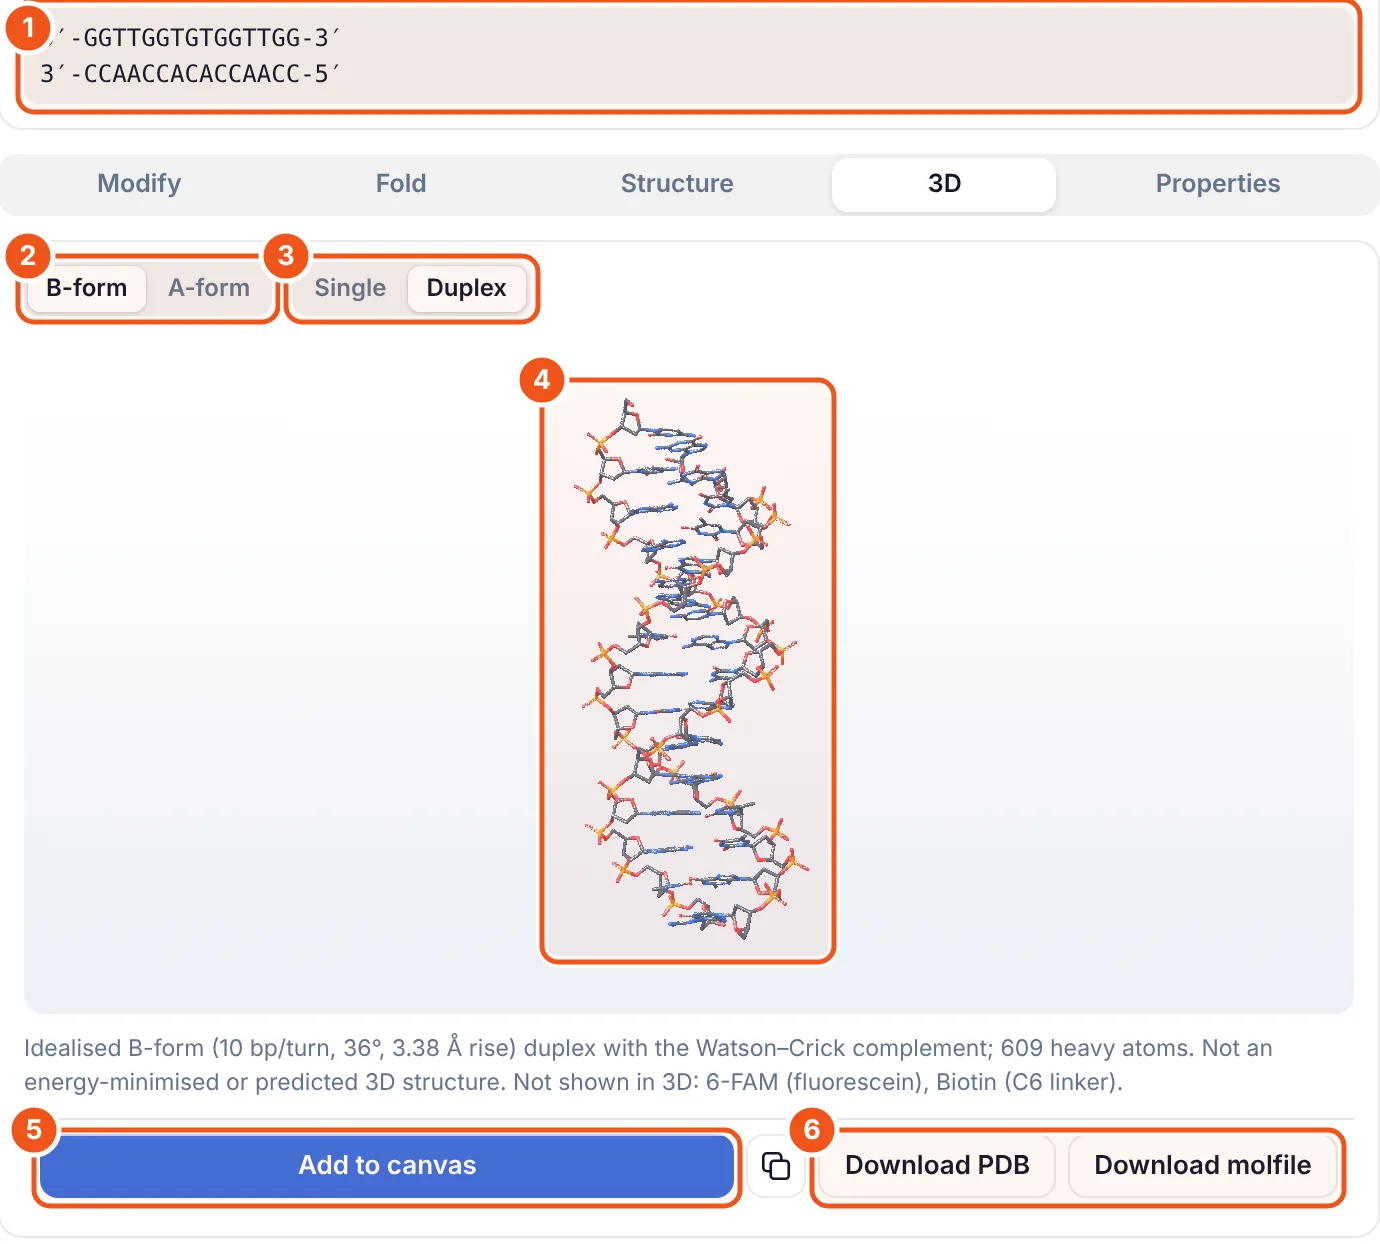
- With Duplex on, the complement is shown under the strand (5′-GGTTGGTGTGGTTGG-3′ / 3′-CCAACCACACCAACC-5′).
- B-form (10 bp per turn) or A-form (11 bp per turn) helix.
- Single strand in helical shape, or the Watson-Crick Duplex.
- The model. Drag to rotate, scroll to zoom.
- Add to canvas inserts a snapshot of the view.
- Download PDB or molfile for PyMOL, Chimera or docking.
These are fibre-model helices, not predicted or energy-minimised structures: an aptamer is shown as a straight helix. Dyes and linkers are not drawn in 3D.
Step 9: Read masses, Tm and ε260
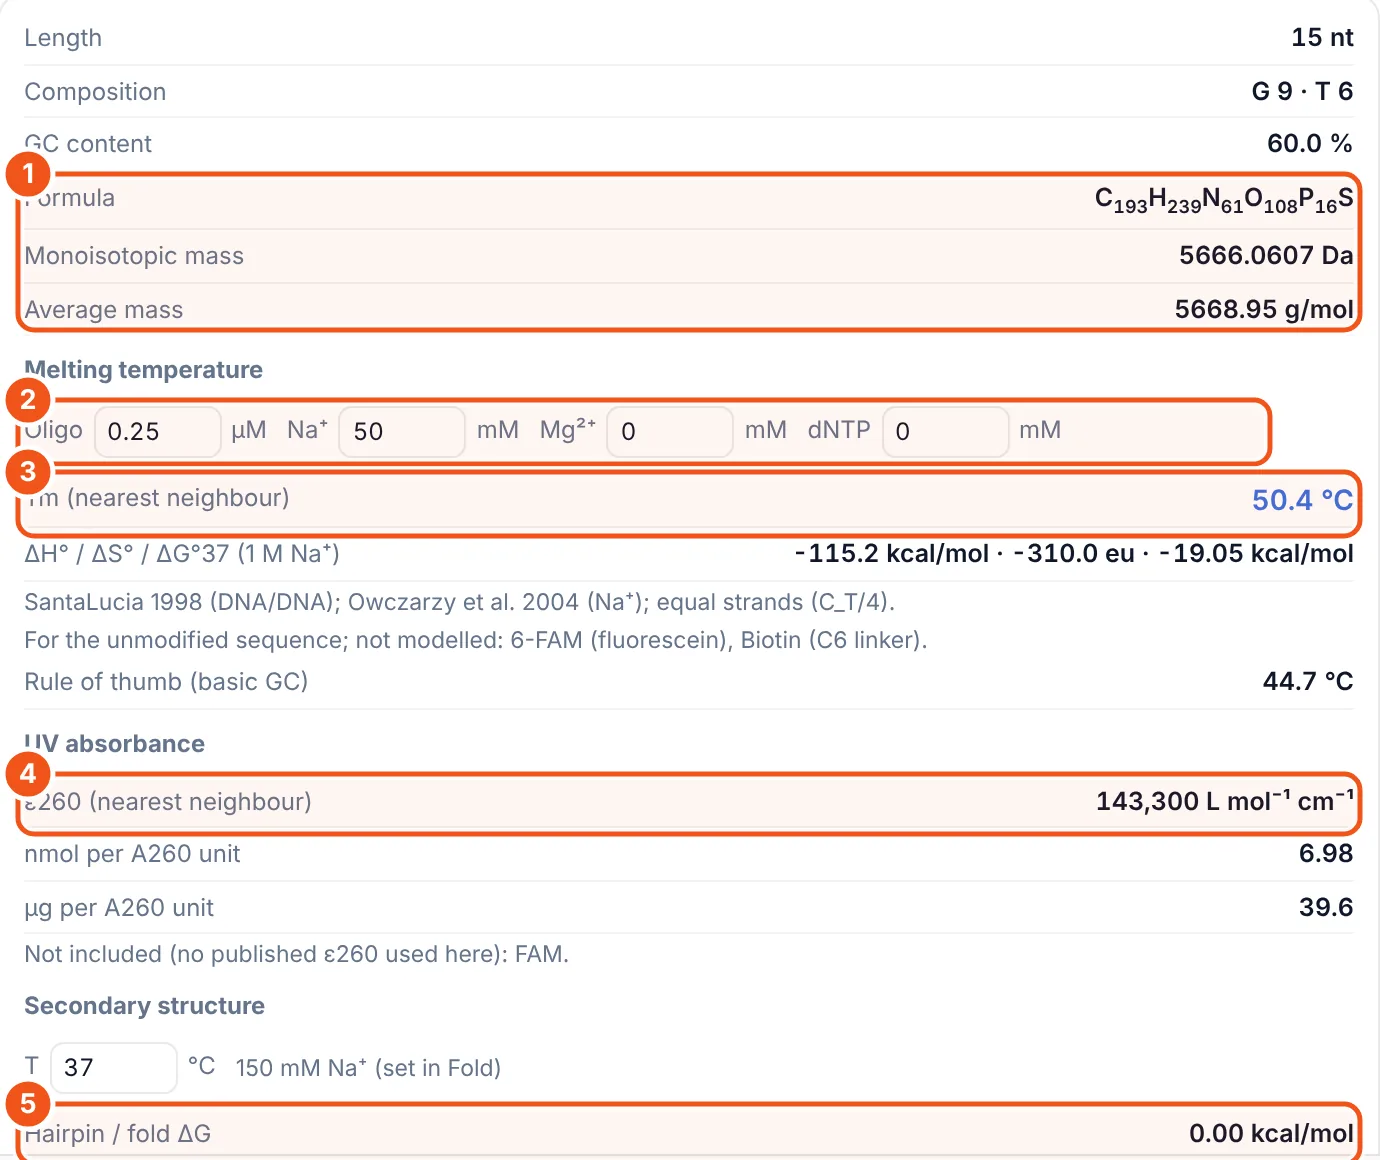
- Formula, monoisotopic and average mass, including the labels. Use them to check an ESI or MALDI spectrum.
- Buffer for the melting temperature: oligo concentration, Na⁺, Mg²⁺ and dNTP.
- Tm from the nearest-neighbour model (SantaLucia 1998 for DNA; salt correction by Owczarzy). The basic GC rule of thumb is shown below it for comparison.
- ε260, the extinction coefficient at 260 nm, with nmol and µg per A260 unit for quantifying your sample.
- Hairpin (fold) ΔG and, below it, the self-dimer ΔG, to spot primers that fold back or pair with themselves.
The Tm values match Biopython's Tm_NN for 210 out of 210 test cases. Labels such as FAM are not part of the Tm or ε260 models, and the panel says so under each value.
Ways to use it
- Aptamer papers: draw the fold, the G-quadruplex and a labelled schematic for the same sequence.
- Ordering oligos: check mass, Tm and ε260 before you order, and paste IDT codes straight from the order sheet.
- Teaching: show A- and B-form helices, base pairing and the effect of salt on Tm.
- Modelling: download a PDB of the duplex as a starting geometry.
Questions and answers
How do I draw a DNA or RNA structure from a sequence?
Install the Nucleic acid builder add-on in MolDraw, open the DNA/RNA tab, type the sequence 5′ to 3′, open Structure and click Add to canvas. Full-atom mode draws up to 12 nucleotides with every atom; the whole strand is available as SMILES or molfile.
Can I add FAM, Cy5 or biotin to an oligo?
Yes. In Modify, click 5′ or 3′ next to the group, or type it in brackets: [FAM]GGTTGG[Biotin]. IDT codes such as /56-FAM/ also work. Attach any molecule joins your own structure to an end.
How is the secondary structure predicted?
With a minimum free energy fold using the ViennaRNA loop model and the Turner 2004 (RNA) or Mathews 2004 (DNA) parameters, at the temperature and Na+ concentration you set.
Does it predict G-quadruplexes?
It scores the sequence with G4Hunter, finds G-tract motifs and draws a schematic. The strand arrangement is a rule of thumb from loop lengths and is labelled as assumed, not predicted.
How accurate is the melting temperature?
Tm uses the nearest-neighbour model (SantaLucia 1998 for DNA, Xia 1998 for RNA) with Owczarzy salt corrections, and matches Biopython for all 210 test cases. Modifications are not included in the model.
Is the Nucleic acid builder free?
Yes. You only need a free MolDraw account to install add-ons.