IR Prediction Add-on: Predict an IR Spectrum from Your Structure
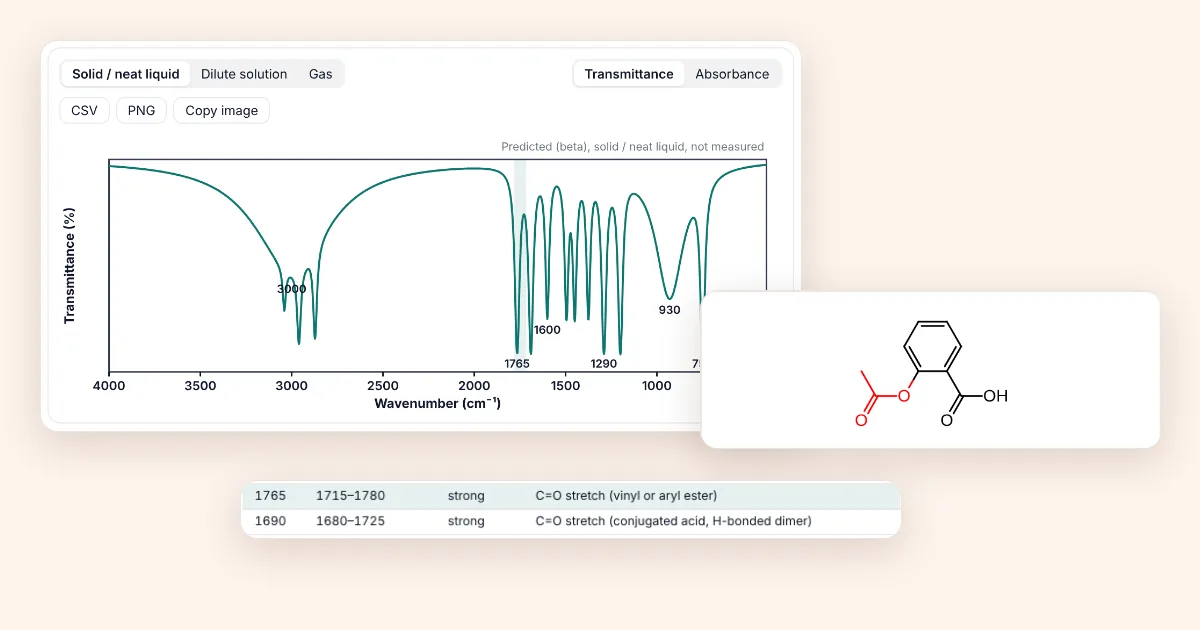
Short answer: Open the 3D viewer, press + and install IR prediction (beta). Draw or paste a molecule and the IR tab shows the predicted bands, a simulated spectrum and the functional group behind each peak. Pick solid, dilute solution or gas, hover a band to see its atoms, and export CSV, PNG or a transparent image. It is a prediction from functional-group rules, not a measured spectrum.
How to read the screenshots: each orange number in a picture matches the numbered note under it. Dashed boxes with a magnified panel are zoomed-in details.
Step 1: Install the IR prediction add-on
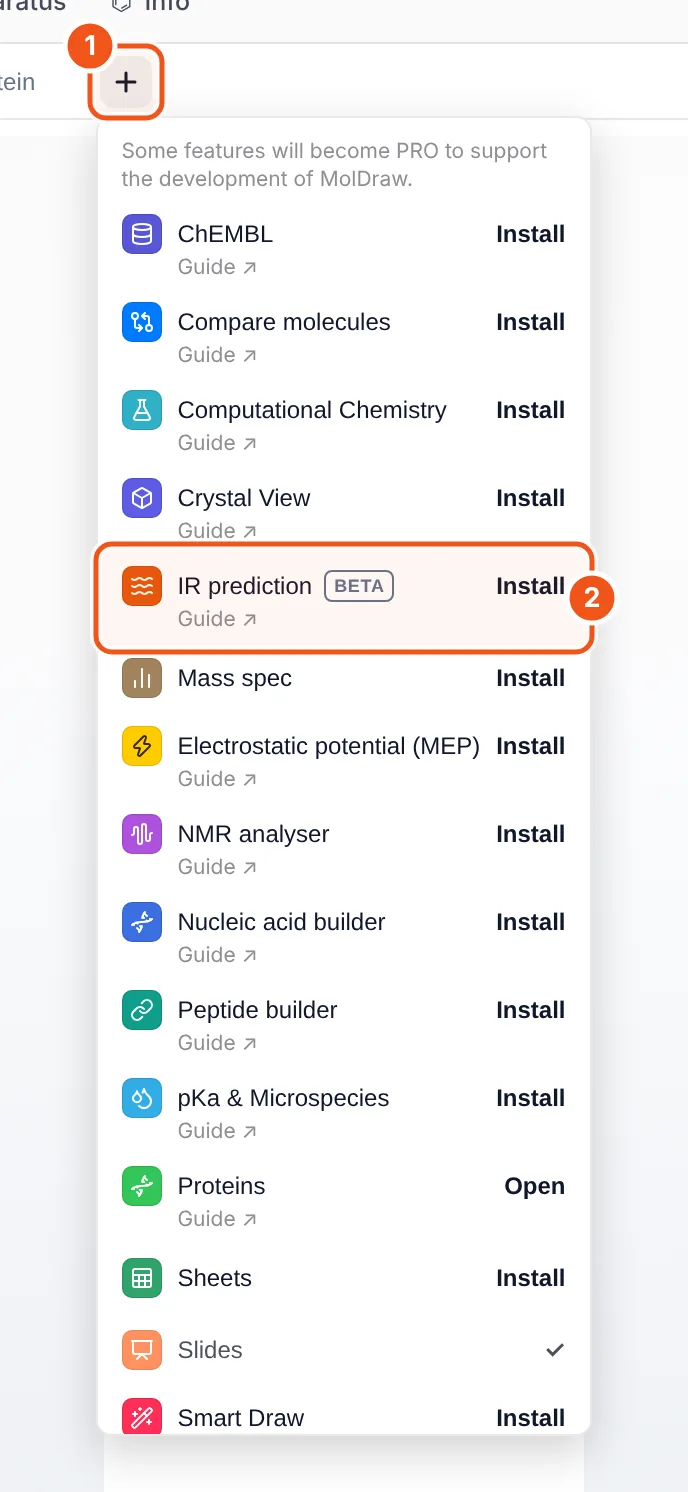
- The + button at the end of the tab row (Structure, Protein, …) opens the add-on menu.
- IR prediction: click Install and a IR tab appears.
- Open the MolDraw editor and sign in. A free account is enough to use add-ons.
- Open the 3D viewer on the right (the 3D button at the bottom of the atom bar) and press + next to the tabs.
- Click Install next to IR prediction (callout 2). The IR tab opens, and the button changes to Open.
Add-ons stay installed on your account. To remove one, hover its tab and click the small ×. You can also manage them under Settings › Plugins.
Step 2: Draw a molecule and read the IR tab
Draw or paste any organic structure on the canvas (here aspirin, CC(=O)Oc1ccccc1C(=O)O). The IR tab updates by itself; if you select part of the drawing, only the selection is analysed.
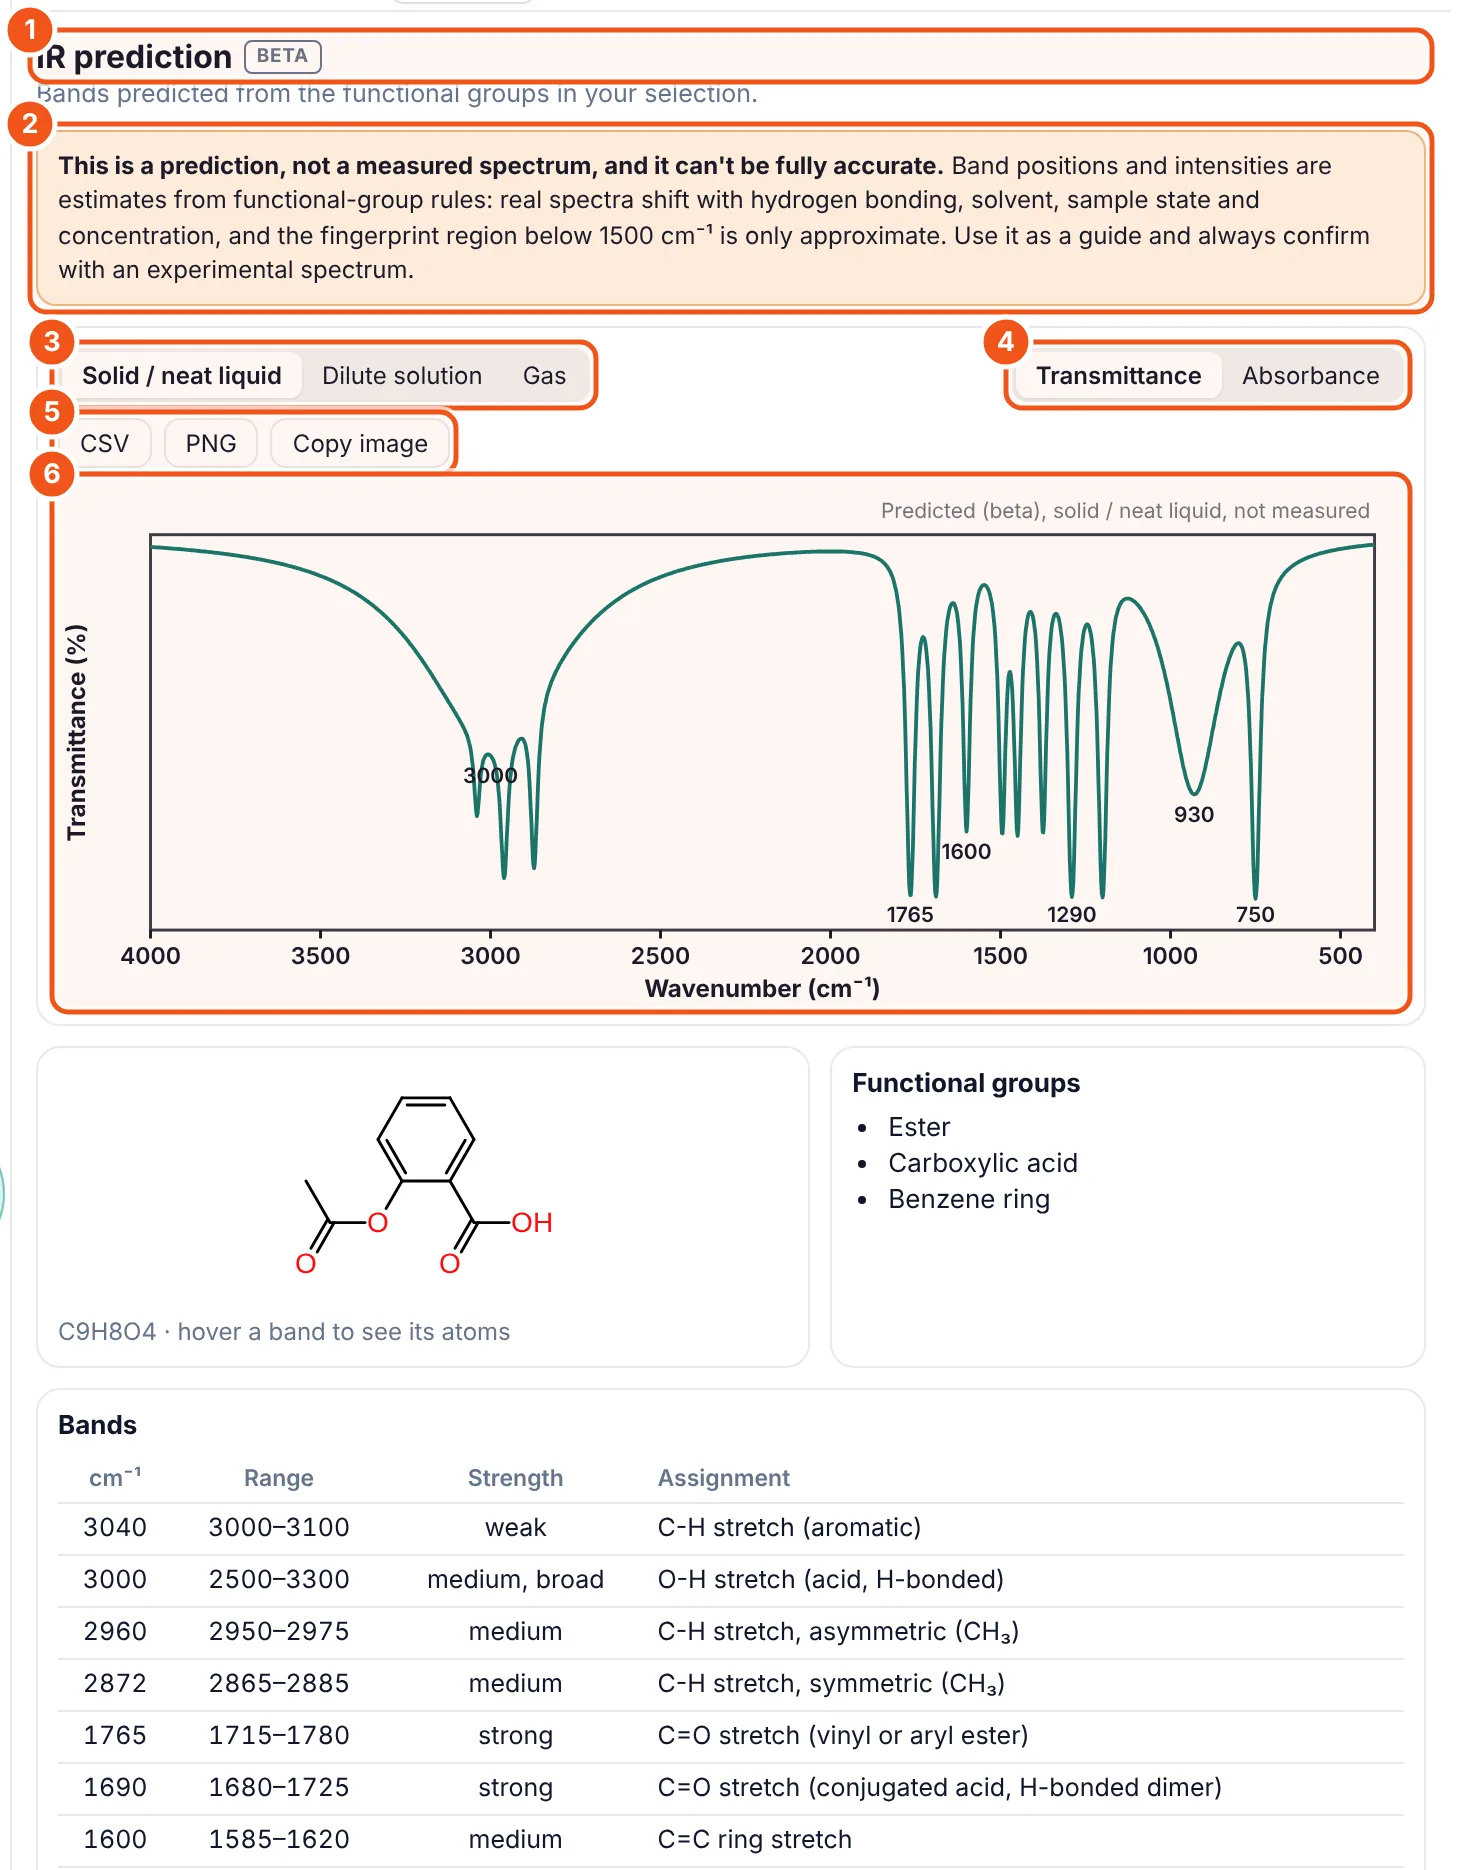
- IR prediction, BETA. The add-on is in beta: the rules are still being extended and checked.
- The warning. This is a prediction from functional-group rules, not a measured spectrum. Always confirm with your own spectrum.
- Sample state. Solid / neat liquid (default), dilute solution or gas. O–H, N–H and acid bands move a lot between them (step 4).
- Y axis. Transmittance (dips, like most printed spectra) or absorbance (peaks).
- Export. CSV with the curve and the band list, PNG with a white background, or Copy image as a transparent PNG for slides.
- The predicted spectrum. Strong and medium bands are labelled with their wavenumber. The caption repeats the sample state and that the spectrum is predicted.
Step 3: Find out what each peak is
Below the spectrum are the structure, the functional groups that were found and the full band table. Hover any row, or a peak label in the plot, to see which atoms it belongs to.
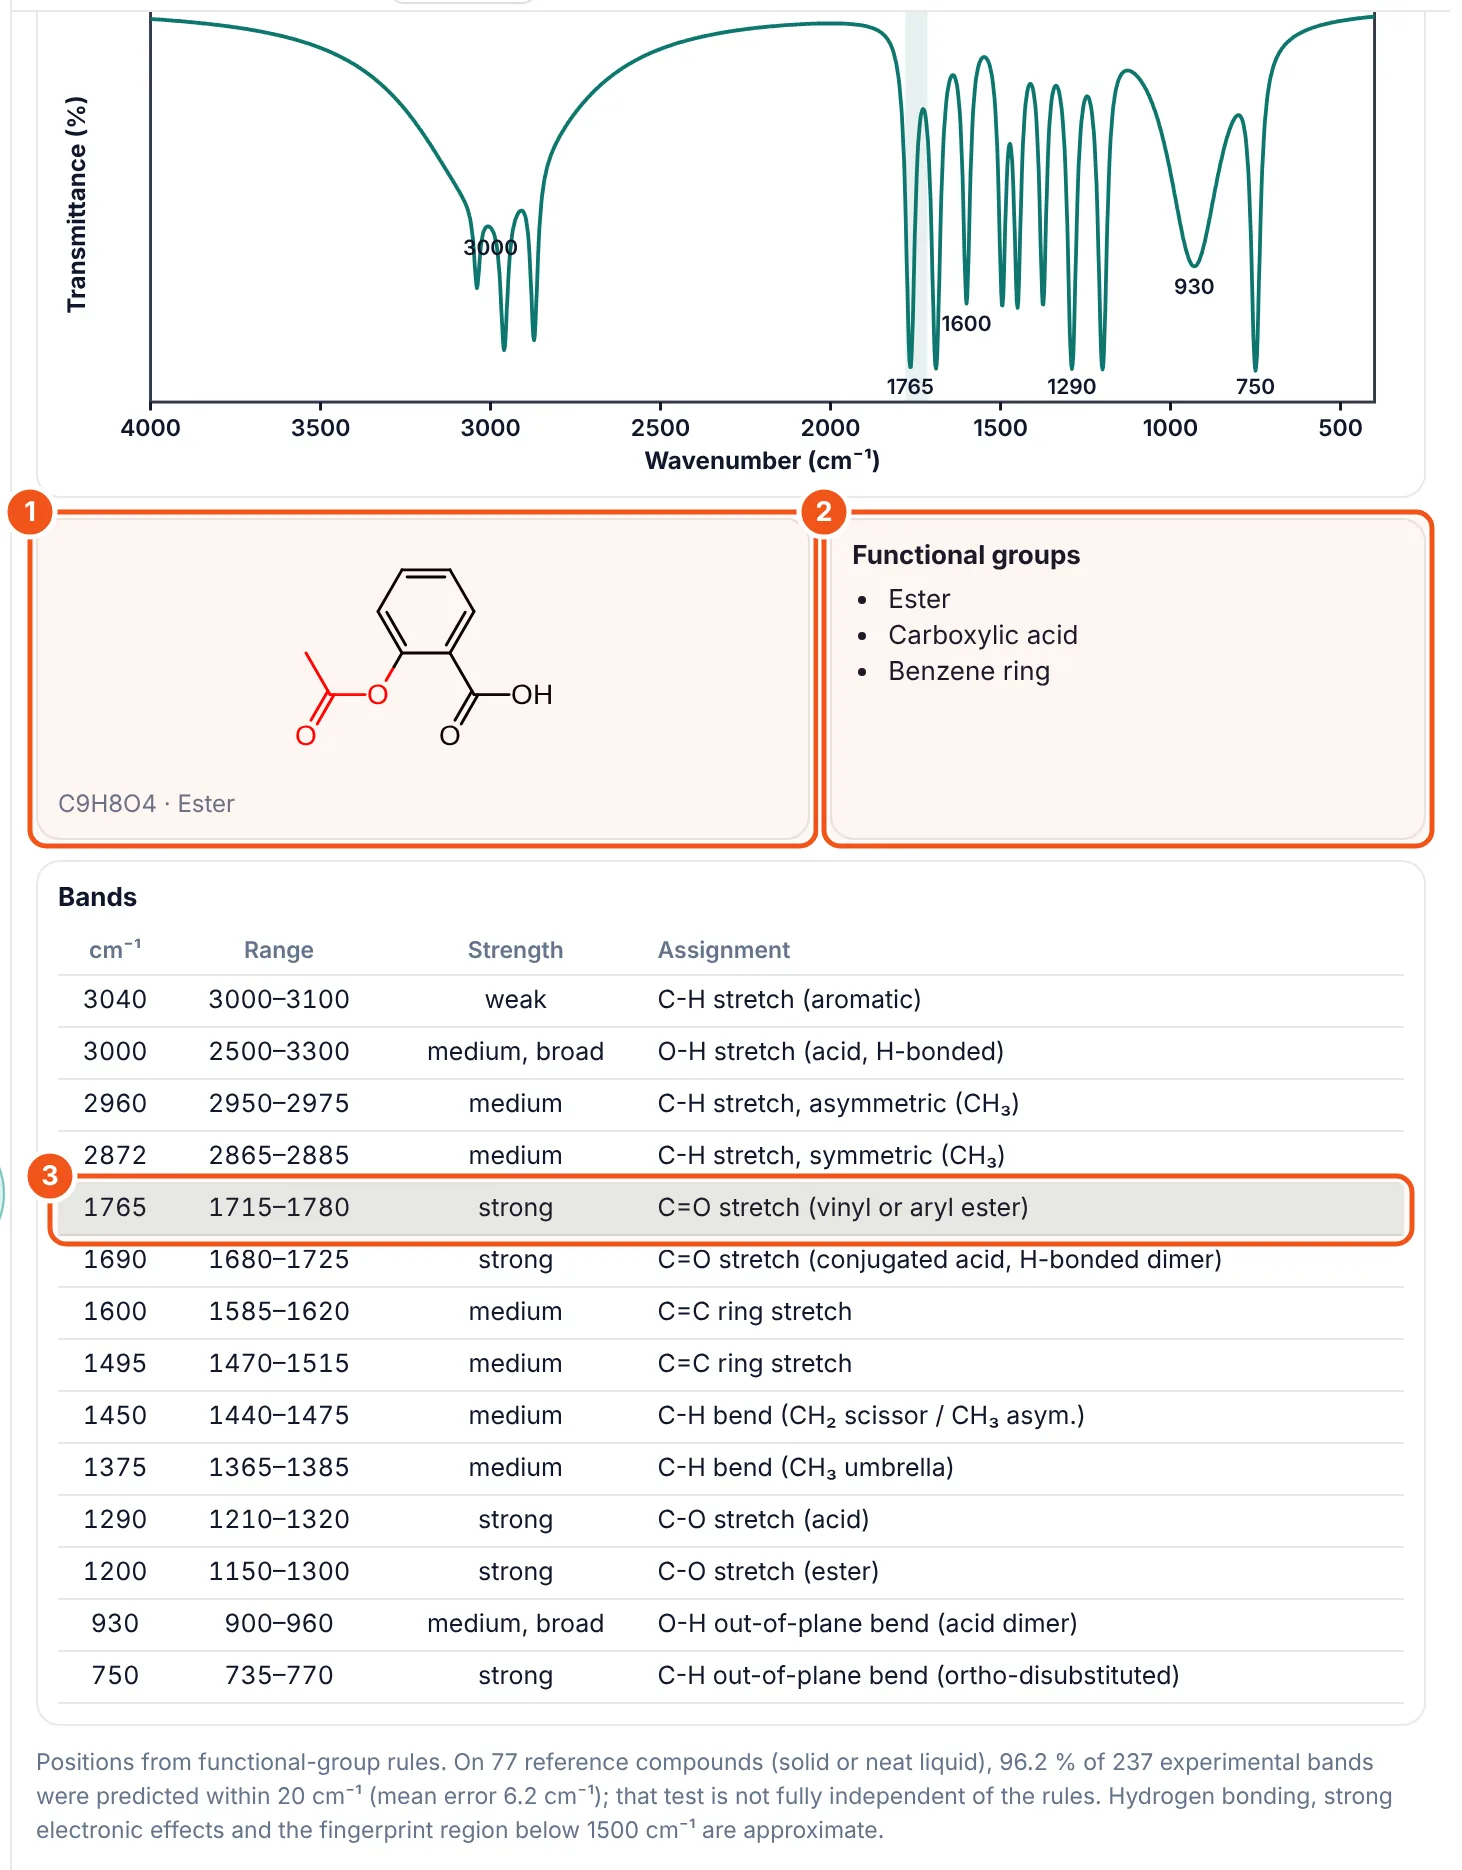
- Structure. The atoms behind the hovered band turn red: here the acetyl ester, O=C–O.
- Functional groups. Every group the rules recognised, with a count when a group occurs more than once.
- Band table. Position, usual range, strength and the assignment, for example "C=O stretch (vinyl or aryl ester)". Aspirin has two C=O bands: the aryl ester at 1765 and the acid dimer at 1690.
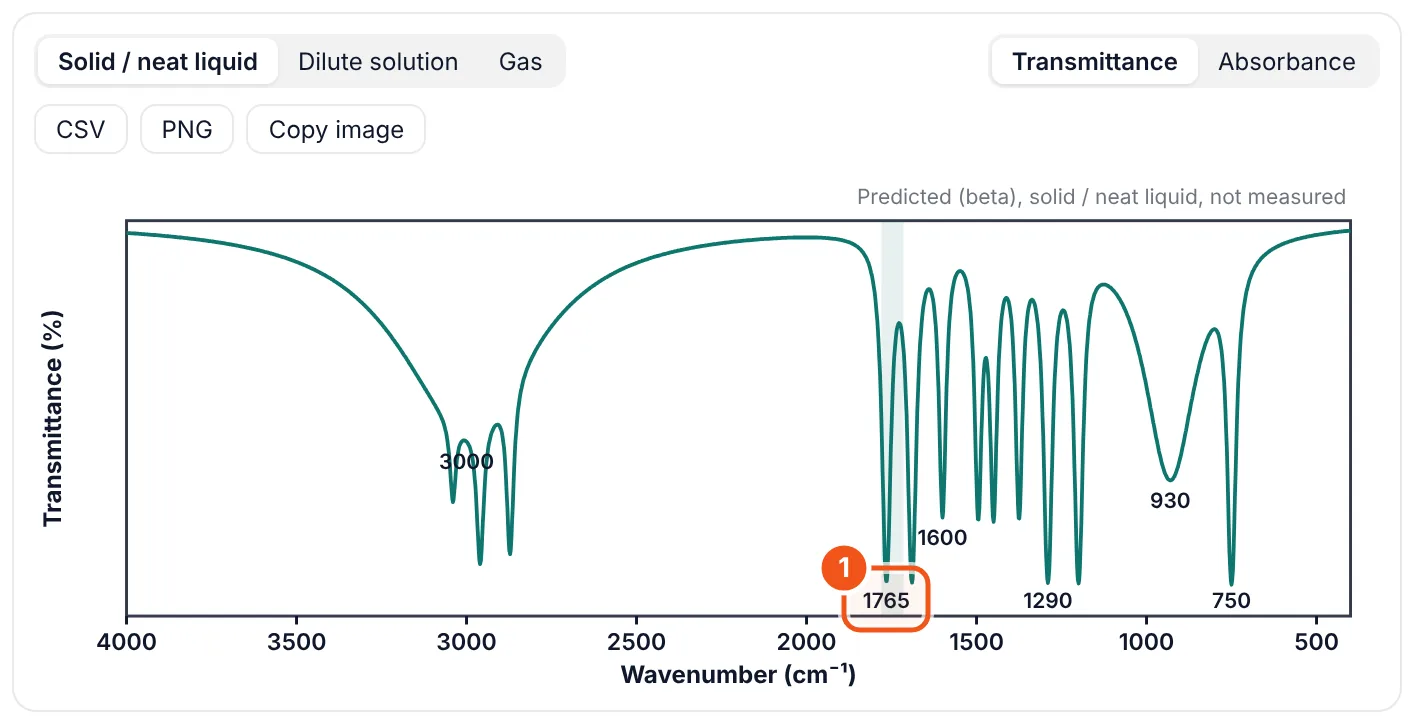
- Hovering a peak label (here 1765) shades that band's range in the spectrum.
The table covers stretches, the main bends and the C–O, C–N and C–X bands. Band positions take the neighbourhood into account: conjugation, ring strain, an intramolecular hydrogen bond, a donor group para to an aryl carbonyl and halogens next to a C=O all move the C=O band.
Step 4: Choose the sample state
An IR spectrum depends on how the sample was measured. In a KBr pellet, an ATR crystal or a neat liquid, O–H and N–H groups are hydrogen-bonded; in a dilute CCl₄ or CHCl₃ solution some of them are free; in the gas phase none are. Salicylic acid shows the difference well.
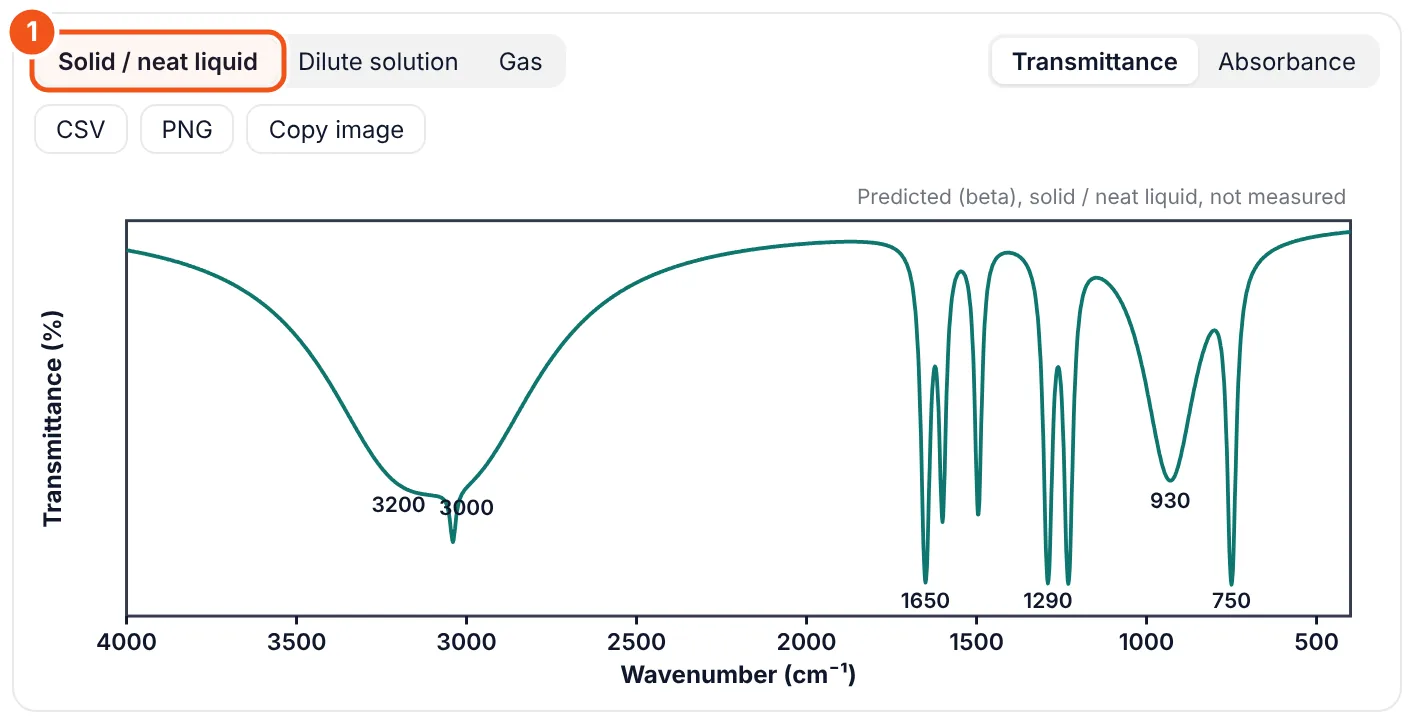
- Solid / neat liquid is the default and matches KBr and ATR spectra.
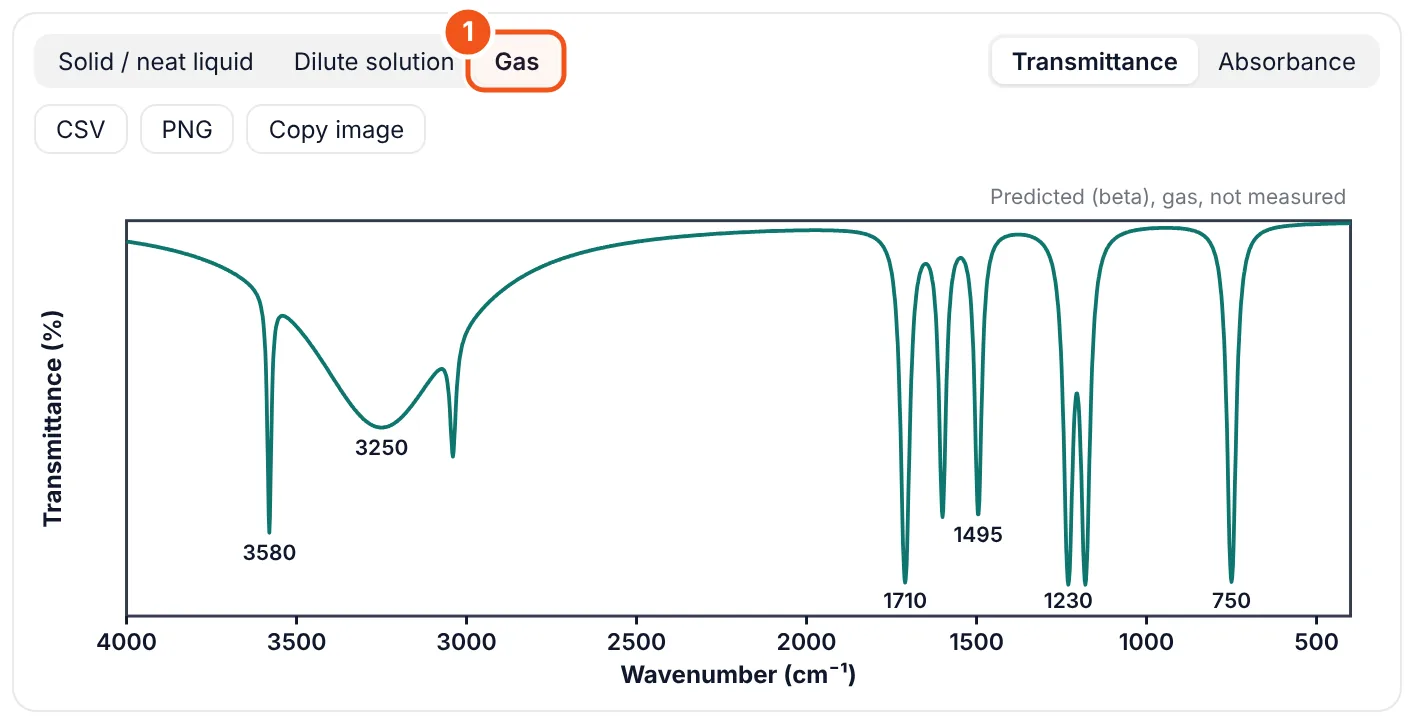
- Gas: free O–H and N–H, acid monomers, C=O about 20 cm⁻¹ higher than in the solid.
| Solid / neat liquid | Hydrogen-bonded O–H near 3350, acid O–H 2500–3300, acid C=O near 1710. Use for KBr, ATR, Nujol and neat films. |
|---|---|
| Dilute solution (<1 %) | Adds sharp free O–H (about 3630, phenols 3610) and acid monomer bands next to the bonded ones; amide N–H and C=O move up. For 5–10 % solutions in CCl₄ or CHCl₃, which are still largely hydrogen-bonded, choose Solid / neat liquid. |
| Gas | Only free O–H (3650–3670) and N–H; acids as monomers (C=O near 1780); ketones and esters about 20–25 cm⁻¹ higher. |
The solution and gas positions use textbook offsets and have not been benchmarked yet; the panel says so when you pick them.
Step 5: Read the notes for tricky structures
Some molecules do not exist the way they are drawn. When that changes the spectrum, a note appears above the plot and the bands follow the real form.
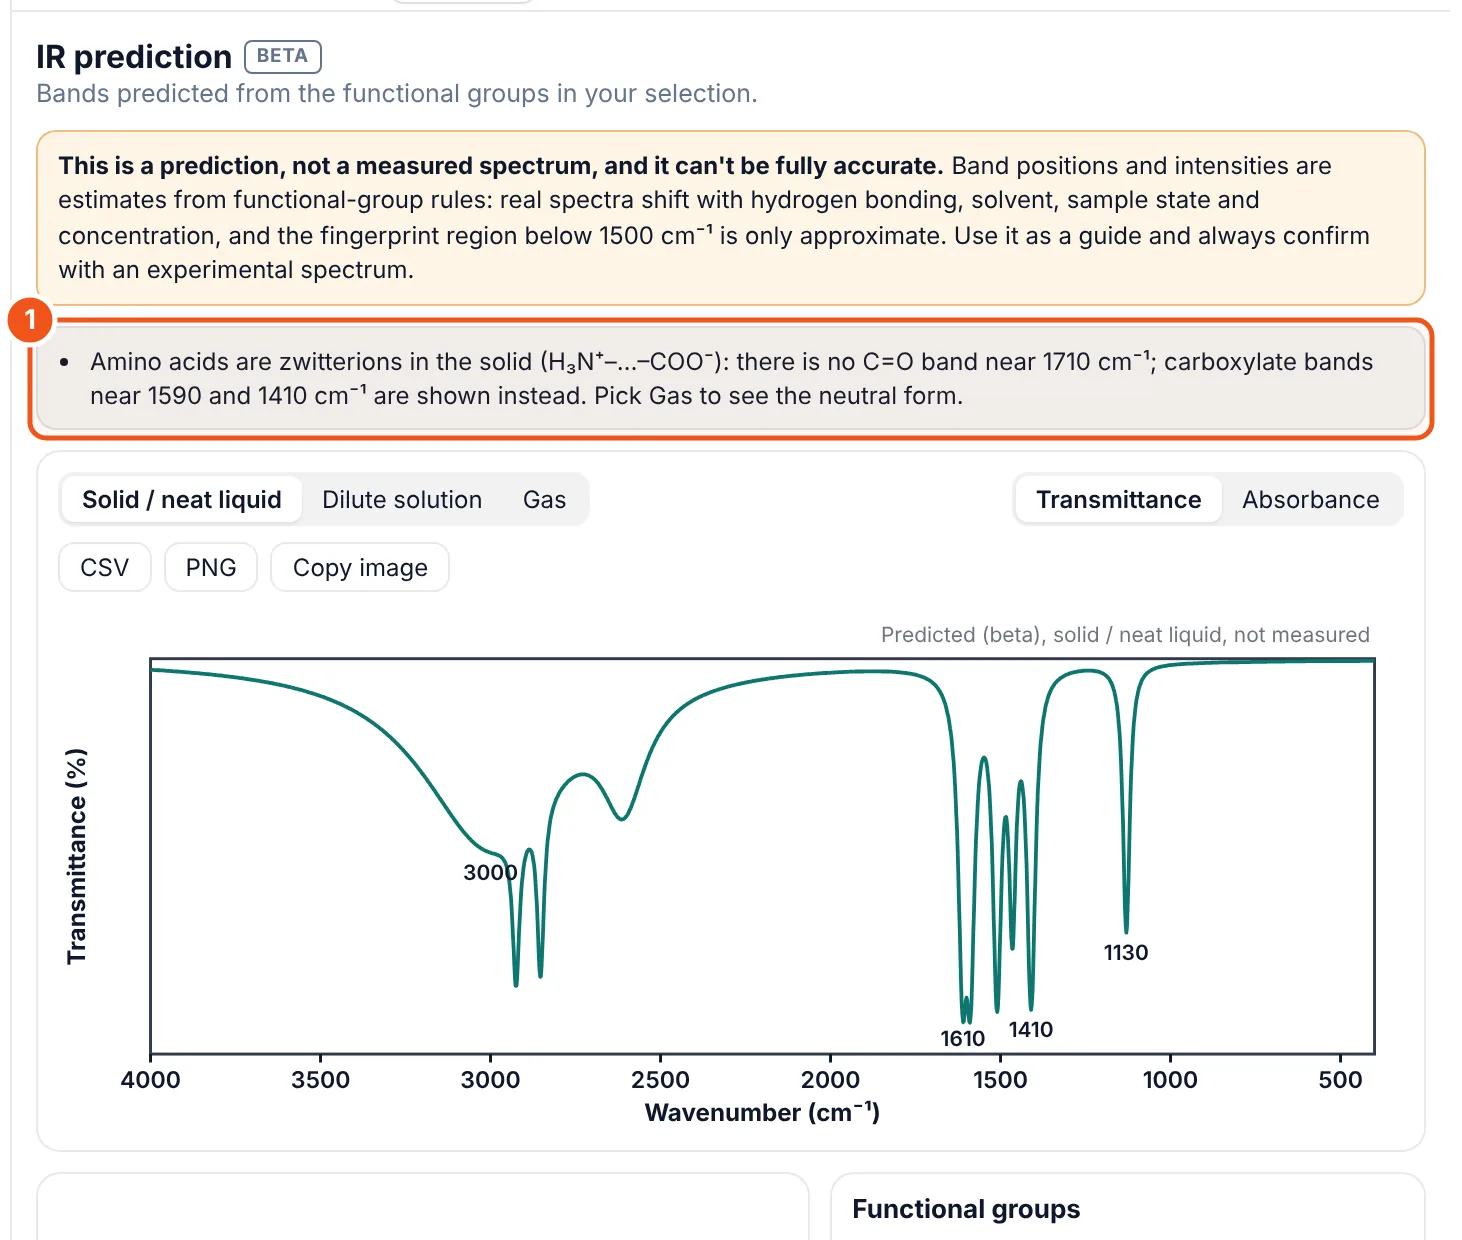
- The note explains what changed and why.
- Amino acids are zwitterions in the solid: NH₃⁺ and COO⁻ bands, no C=O near 1710.
- 1,3-Diketones such as acetylacetone are mostly enol: a strong, broad band near 1615 cm⁻¹ next to a weaker keto C=O pair. Cyclic 1,3-diones are fully enolised in the solid.
- β-Keto esters are mostly keto, with a weak enol band near 1650 cm⁻¹.
- Uracil, thymine and caffeine get pyrimidinedione C=O bands (about 1705 and 1660) rather than imide or urea values.
Step 6: Export the spectrum
- CSV: the simulated curve (wavenumber, absorbance, transmittance) and the band list, headed with the sample state and a note that it is a prediction.
- PNG: the plot at three times screen resolution on white, for reports.
- Copy image: the same plot on a transparent background, straight to the clipboard; paste it into PowerPoint, Keynote or Google Slides.
How accurate is it?
We tested the add-on against measured spectra from the NIST Chemistry WebBook: 505 compounds and 1,257 spectra that the rules were never written from. Half of the compounds were used to calibrate small corrections; the other half was kept aside for the test. On that held-out half (521 key bands: C=O, O–H, N–H, C≡N, NO₂ …), 85 % of the predicted bands were found in the measured spectrum and 69 % were within 20 cm⁻¹ (mean error 13 cm⁻¹). C=O bands do best (88 % within 20 cm⁻¹); broad O–H and N–H bands are the hardest. A plain correlation table, one value per group, got 56 %.
The sample-state option matters: on gas-phase spectra, predictions made for the gas were within 20 cm⁻¹ for 76 % of bands, against 36 % when the same molecules were predicted as solids.
We also compared a quantum-chemical calculation (GFN2-xTB, run in the browser). It was less accurate for the key bands and, in the fingerprint region below 1500 cm⁻¹, matched measured peaks hardly better than chance, while taking seconds to a minute per molecule instead of under a millisecond.
Read the numbers with care. Peaks in the NIST spectra were picked automatically, and intensities are not scored. The fingerprint region and band intensities remain approximate. That is why the add-on is labelled BETA and every view says it is a prediction.
Ways to use it
- Before you measure: know which bands should appear for your target product and which should disappear from the starting material.
- Checking a product: compare the predicted C=O, O–H and N–H positions with your spectrum; a band far from the prediction is worth a second look.
- Teaching: hover a peak to show which group it belongs to; switch between solid and gas to show hydrogen bonding.
- Slides and reports: copy the spectrum as a transparent image, or export the band table as CSV.
Not covered: identifying an unknown compound from its spectrum (the add-on goes from structure to spectrum, not the other way), mixtures, inorganic compounds and metal complexes. For peak look-up, use the IR spectroscopy chart; to open your own measured spectrum, use the IR spectrum viewer.
Questions and answers
How do I predict an IR spectrum from a structure?
In MolDraw, install the free IR prediction add-on from the + next to the 3D viewer tabs, then draw or paste your molecule. The IR tab shows the predicted bands, a simulated spectrum and the functional group behind each peak.
How accurate is the IR prediction?
On 505 compounds from NIST spectra the rules were never written from, 85 % of key bands were found in the measured spectrum and 69 % were within 20 cm⁻¹ on the held-out half (C=O: 88 %). The fingerprint region and intensities are approximate, so always confirm with a measured spectrum.
Can it identify an unknown compound from its IR spectrum?
No. It predicts the spectrum of a structure you draw. To interpret a measured spectrum, look up the peaks in the IR spectroscopy chart and compare with the predictions for your candidate structures.
What is the difference between the solid, solution and gas options?
Solid / neat liquid (KBr, ATR) has hydrogen-bonded O–H and N–H and acid dimers. Dilute solution adds free O–H and N–H bands. Gas has only free O–H and N–H, acid monomers and C=O bands about 20 cm⁻¹ higher.
Does it run in my browser?
Yes. The prediction runs locally in your browser in well under a second; nothing is uploaded.
Is the IR prediction add-on free?
Yes. You only need a free MolDraw account to install add-ons.